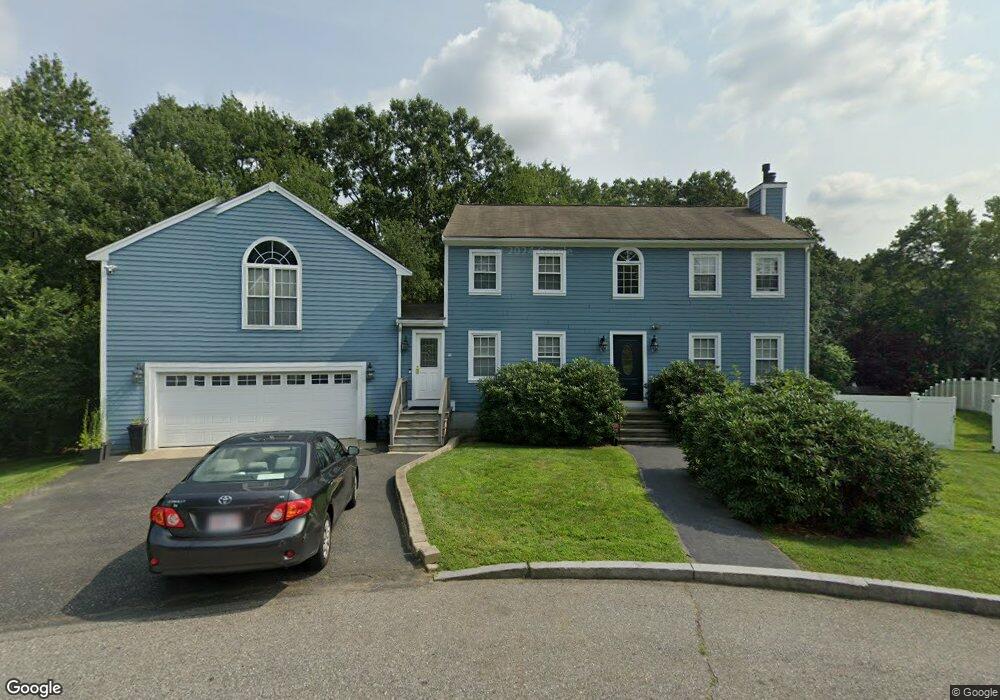
26 Rock St Framingham, MA 01702
Estimated Value: $740,000 - $940,000
4
Beds
5
Baths
3,021
Sq Ft
$282/Sq Ft
Est. Value
About This Home
This home is located at 26 Rock St, Framingham, MA 01702 and is currently estimated at $852,445, approximately $282 per square foot. 26 Rock St is a home located in Middlesex County with nearby schools including Framingham High School, Pincushion Hill Montessori School, and Saint Bridget School.
Ownership History
Date
Name
Owned For
Owner Type
Purchase Details
Closed on
Jun 30, 2011
Sold by
Fischesser Brian J and Fischesser Jennifer W
Bought by
Defaria Silvio R and Defaria Edvalda M
Current Estimated Value
Home Financials for this Owner
Home Financials are based on the most recent Mortgage that was taken out on this home.
Original Mortgage
$307,000
Outstanding Balance
$212,300
Interest Rate
4.62%
Mortgage Type
Purchase Money Mortgage
Estimated Equity
$640,145
Purchase Details
Closed on
Sep 5, 2003
Sold by
Gentile Christopher D and Gentile Jane E
Bought by
Fischesser Brian J and Fischesser Jennifer W
Purchase Details
Closed on
Oct 30, 1998
Sold by
Uliss Steven A and Uliss Amy D
Bought by
Gentile Christopher D and Gentile Jane E
Purchase Details
Closed on
Sep 30, 1994
Sold by
High Rock Acres Rt and Bartolini Bruce
Bought by
Uliss Steven A and Uliss Amy D
Create a Home Valuation Report for This Property
The Home Valuation Report is an in-depth analysis detailing your home's value as well as a comparison with similar homes in the area
Home Values in the Area
Average Home Value in this Area
Purchase History
| Date | Buyer | Sale Price | Title Company |
|---|---|---|---|
| Defaria Silvio R | $427,000 | -- | |
| Defaria Silvio R | $427,000 | -- | |
| Fischesser Brian J | $445,000 | -- | |
| Fischesser Brian J | $445,000 | -- | |
| Gentile Christopher D | $240,000 | -- | |
| Uliss Steven A | $179,900 | -- | |
| Uliss Steven A | $179,900 | -- |
Source: Public Records
Mortgage History
| Date | Status | Borrower | Loan Amount |
|---|---|---|---|
| Open | Defaria Silvio R | $307,000 | |
| Closed | Uliss Steven A | $307,000 | |
| Previous Owner | Uliss Steven A | $324,000 |
Source: Public Records
Tax History Compared to Growth
Tax History
| Year | Tax Paid | Tax Assessment Tax Assessment Total Assessment is a certain percentage of the fair market value that is determined by local assessors to be the total taxable value of land and additions on the property. | Land | Improvement |
|---|---|---|---|---|
| 2025 | $9,864 | $826,100 | $289,500 | $536,600 |
| 2024 | $9,691 | $777,800 | $258,400 | $519,400 |
| 2023 | $9,388 | $717,200 | $230,600 | $486,600 |
| 2022 | $8,961 | $652,200 | $209,300 | $442,900 |
| 2021 | $8,729 | $621,300 | $201,100 | $420,200 |
| 2020 | $8,852 | $590,900 | $182,800 | $408,100 |
| 2019 | $8,814 | $573,100 | $182,800 | $390,300 |
| 2018 | $8,646 | $529,800 | $175,900 | $353,900 |
| 2017 | $8,330 | $498,500 | $170,800 | $327,700 |
| 2016 | $8,289 | $476,900 | $170,800 | $306,100 |
| 2015 | $8,210 | $460,700 | $170,900 | $289,800 |
Source: Public Records
Map
Nearby Homes
- 8 Bellmore Rd
- 15 Bellmore Rd
- 116 Waverly St
- 45 Daytona Ave
- 818 Waverly St
- 51 Crest Rd
- 84 Bethany Rd
- 131 Mellen St Unit 3B
- 12 & 14 Waverly St
- 13 Washington Ave
- 292 Hollis St
- 302 Hollis St Unit R
- 15 Bates Rd
- 72 Pond St
- 25 Eames St
- 12 Alfred Rd
- 77 Arlington St
- 29 Gordon St Unit 107
- 343 Captain Eames Cir Unit 38-C
- 379 Captain Eames Cir