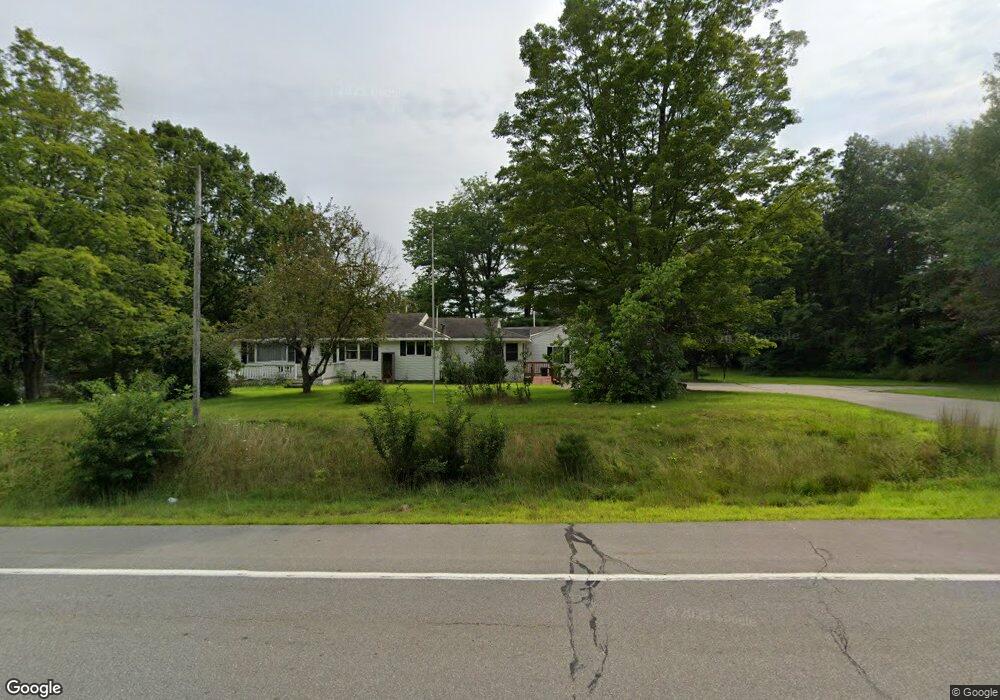
26 Route 236 Berwick, ME 03901
Estimated Value: $373,000 - $561,000
5
Beds
2
Baths
2,520
Sq Ft
$180/Sq Ft
Est. Value
About This Home
This home is located at 26 Route 236, Berwick, ME 03901 and is currently estimated at $453,540, approximately $179 per square foot. 26 Route 236 is a home located in York County with nearby schools including Noble High School and Tri-City Christian Academy.
Ownership History
Date
Name
Owned For
Owner Type
Purchase Details
Closed on
Oct 4, 2023
Sold by
Mathews Marion G Est and Parent
Bought by
Aku Rebecca G and Aku Bright C
Current Estimated Value
Home Financials for this Owner
Home Financials are based on the most recent Mortgage that was taken out on this home.
Original Mortgage
$240,000
Outstanding Balance
$234,945
Interest Rate
7.23%
Mortgage Type
Purchase Money Mortgage
Estimated Equity
$218,595
Purchase Details
Closed on
May 16, 2023
Sold by
Mathews Marion G Est and Parent
Bought by
Green Brenda L and Green Jonathan B
Create a Home Valuation Report for This Property
The Home Valuation Report is an in-depth analysis detailing your home's value as well as a comparison with similar homes in the area
Home Values in the Area
Average Home Value in this Area
Purchase History
| Date | Buyer | Sale Price | Title Company |
|---|---|---|---|
| Aku Rebecca G | $300,000 | None Available | |
| Aku Rebecca G | $300,000 | None Available | |
| Aku Rebecca G | $300,000 | None Available | |
| Green Brenda L | $90,000 | None Available | |
| Green Brenda L | $90,000 | None Available | |
| Green Brenda L | $90,000 | None Available |
Source: Public Records
Mortgage History
| Date | Status | Borrower | Loan Amount |
|---|---|---|---|
| Open | Aku Rebecca G | $240,000 | |
| Closed | Aku Rebecca G | $240,000 |
Source: Public Records
Tax History Compared to Growth
Tax History
| Year | Tax Paid | Tax Assessment Tax Assessment Total Assessment is a certain percentage of the fair market value that is determined by local assessors to be the total taxable value of land and additions on the property. | Land | Improvement |
|---|---|---|---|---|
| 2024 | $5,269 | $422,500 | $104,200 | $318,300 |
| 2023 | $5,538 | $302,300 | $96,700 | $205,600 |
| 2022 | $5,508 | $302,300 | $96,700 | $205,600 |
| 2021 | $5,532 | $302,300 | $96,700 | $205,600 |
| 2020 | $5,225 | $269,900 | $96,700 | $173,200 |
| 2019 | $4,731 | $269,900 | $96,700 | $173,200 |
| 2018 | $5,108 | $290,200 | $92,000 | $198,200 |
| 2017 | $4,977 | $290,200 | $92,000 | $198,200 |
| 2016 | $4,730 | $290,200 | $92,000 | $198,200 |
| 2014 | $4,614 | $290,200 | $92,000 | $198,200 |
| 2013 | $4,884 | $304,300 | $92,000 | $212,300 |
Source: Public Records
Map
Nearby Homes