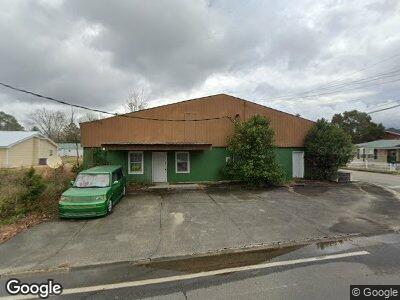
26 S Peters St Claxton, GA 30417
Estimated Value: $83,666
--
Bed
--
Bath
6,283
Sq Ft
$13/Sq Ft
Est. Value
About This Home
This home is located at 26 S Peters St, Claxton, GA 30417 and is currently estimated at $83,666, approximately $13 per square foot. 26 S Peters St is a home located in Evans County with nearby schools including Claxton Elementary School, Second Chance, and Claxton Middle School.
Ownership History
Date
Name
Owned For
Owner Type
Purchase Details
Closed on
Dec 13, 2017
Sold by
Ba Blair Developments Llc
Bought by
Gay Tina Reynale
Current Estimated Value
Purchase Details
Closed on
Mar 25, 2008
Sold by
Maier Mark E
Bought by
B A Blair Developments Llc
Purchase Details
Closed on
Jan 3, 2005
Sold by
Old Vidalia Investment Par
Bought by
Maier Mark
Home Financials for this Owner
Home Financials are based on the most recent Mortgage that was taken out on this home.
Original Mortgage
$27,775
Interest Rate
5.71%
Mortgage Type
Commercial
Purchase Details
Closed on
Dec 20, 2002
Sold by
The Tattnall Bank
Bought by
Old Vidalia Investment Partners Inc
Purchase Details
Closed on
Feb 5, 2002
Sold by
Dasher Joseph M
Bought by
The Tattnall Bank
Purchase Details
Closed on
Nov 3, 1998
Sold by
Borden James T
Bought by
Dasher Joseph M
Purchase Details
Closed on
Jul 16, 1998
Sold by
Smith Gary E
Bought by
Borden James T
Purchase Details
Closed on
Mar 23, 1982
Sold by
Small Business Administration
Bought by
Smith Gary E
Create a Home Valuation Report for This Property
The Home Valuation Report is an in-depth analysis detailing your home's value as well as a comparison with similar homes in the area
Home Values in the Area
Average Home Value in this Area
Purchase History
| Date | Buyer | Sale Price | Title Company |
|---|---|---|---|
| Gay Tina Reynale | -- | -- | |
| B A Blair Developments Llc | $44,000 | -- | |
| Maier Mark | $27,500 | -- | |
| Old Vidalia Investment Partners Inc | $25,000 | -- | |
| The Tattnall Bank | -- | -- | |
| Dasher Joseph M | -- | -- | |
| Borden James T | $30,000 | -- | |
| Smith Gary E | -- | -- |
Source: Public Records
Mortgage History
| Date | Status | Borrower | Loan Amount |
|---|---|---|---|
| Previous Owner | Blair Brandon | $52,310 | |
| Previous Owner | Maier Mark | $27,775 |
Source: Public Records
Tax History Compared to Growth
Tax History
| Year | Tax Paid | Tax Assessment Tax Assessment Total Assessment is a certain percentage of the fair market value that is determined by local assessors to be the total taxable value of land and additions on the property. | Land | Improvement |
|---|---|---|---|---|
| 2024 | $960 | $38,680 | $4,600 | $34,080 |
| 2023 | $694 | $15,160 | $3,200 | $11,960 |
| 2022 | $116 | $3,200 | $3,200 | $0 |
| 2021 | $534 | $15,160 | $3,200 | $11,960 |
| 2020 | $536 | $15,160 | $3,200 | $11,960 |
| 2019 | $494 | $15,160 | $3,200 | $11,960 |
| 2018 | $495 | $15,160 | $3,200 | $11,960 |
| 2017 | $483 | $15,160 | $3,200 | $11,960 |
| 2016 | $487 | $15,160 | $3,200 | $11,960 |
| 2015 | -- | $17,440 | $4,400 | $13,040 |
| 2014 | -- | $17,440 | $4,400 | $13,040 |
| 2013 | -- | $17,400 | $3,200 | $14,200 |
Source: Public Records
Map
Nearby Homes
- 207 S Peters St
- 0 U S 301
- 109 Penn Ave
- 201 New Dr
- 9305 & 9307 Daisy Nevils Hwy
- 110 N Claxton Ave
- 206 New Dr
- 103 Marguerite St
- 11 Marguerite St
- 107 Marguerite St
- 3 S Spring St
- 403 W Smith St
- 610 W Liberty St
- 606 Park Ave
- 4 Honeysuckle Dr
- 703 Wells St
- 19 Wysteria Dr
- 12 Wysteria Dr
- 8 Wysteria Dr
- 1717 Perkins Mill Rd