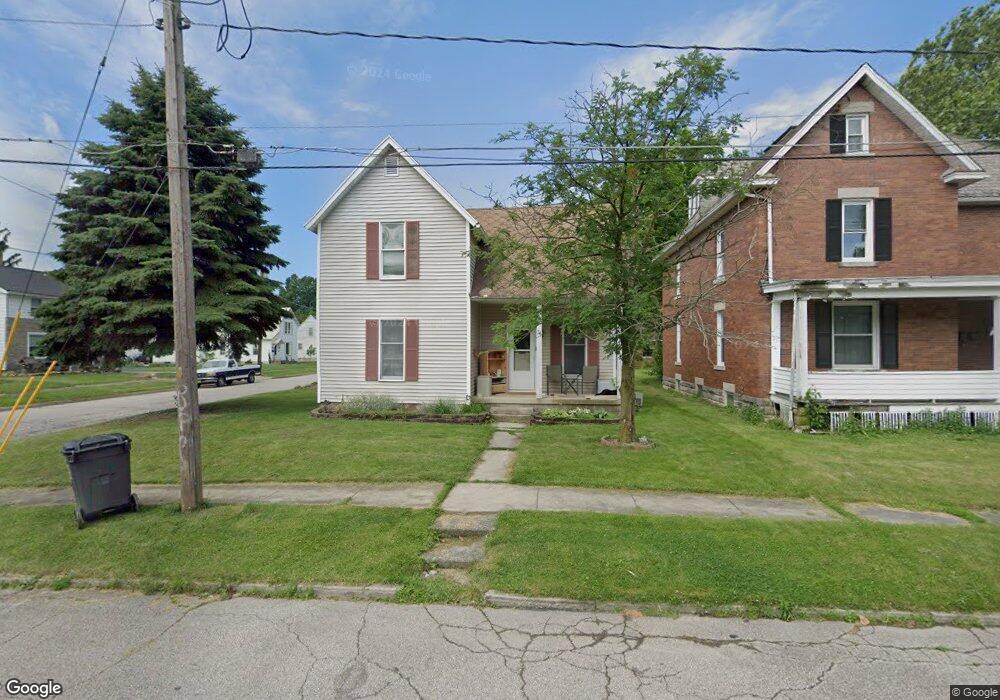
26 Seltzer Ave Shelby, OH 44875
Estimated Value: $110,000 - $150,000
3
Beds
1
Bath
1,360
Sq Ft
$94/Sq Ft
Est. Value
About This Home
This home is located at 26 Seltzer Ave, Shelby, OH 44875 and is currently estimated at $128,151, approximately $94 per square foot. 26 Seltzer Ave is a home located in Richland County with nearby schools including St. Mary's School.
Ownership History
Date
Name
Owned For
Owner Type
Purchase Details
Closed on
Dec 5, 2011
Sold by
Hsbc Mortgage Services Inc
Bought by
Adkinson Braden T
Current Estimated Value
Purchase Details
Closed on
Apr 23, 2011
Sold by
Marx Michelle and Kinsey Robert
Bought by
Hsbc Mortgage Services Inc
Purchase Details
Closed on
Aug 7, 1996
Sold by
Ellis Robert E
Bought by
Marx Jeff S and Marx Michelle R
Purchase Details
Closed on
Mar 1, 1986
Create a Home Valuation Report for This Property
The Home Valuation Report is an in-depth analysis detailing your home's value as well as a comparison with similar homes in the area
Home Values in the Area
Average Home Value in this Area
Purchase History
| Date | Buyer | Sale Price | Title Company |
|---|---|---|---|
| Adkinson Braden T | $25,000 | Omega Title Agency Llc | |
| Hsbc Mortgage Services Inc | -- | Omega Title Agency Llc | |
| Marx Jeff S | $45,000 | -- | |
| -- | $22,000 | -- |
Source: Public Records
Mortgage History
| Date | Status | Borrower | Loan Amount |
|---|---|---|---|
| Closed | Marx Jeff S | $0 |
Source: Public Records
Tax History Compared to Growth
Tax History
| Year | Tax Paid | Tax Assessment Tax Assessment Total Assessment is a certain percentage of the fair market value that is determined by local assessors to be the total taxable value of land and additions on the property. | Land | Improvement |
|---|---|---|---|---|
| 2024 | $1,075 | $27,440 | $4,310 | $23,130 |
| 2023 | $1,075 | $27,440 | $4,310 | $23,130 |
| 2022 | $623 | $14,230 | $4,350 | $9,880 |
| 2021 | $623 | $14,230 | $4,350 | $9,880 |
| 2020 | $624 | $14,230 | $4,350 | $9,880 |
| 2019 | $586 | $12,260 | $3,690 | $8,570 |
| 2018 | $581 | $12,260 | $3,690 | $8,570 |
| 2017 | $823 | $17,550 | $3,690 | $13,860 |
| 2016 | $388 | $8,320 | $3,510 | $4,810 |
| 2015 | $386 | $8,320 | $3,510 | $4,810 |
| 2014 | $373 | $8,320 | $3,510 | $4,810 |
| 2012 | $193 | $8,750 | $3,690 | $5,060 |
Source: Public Records
Map
Nearby Homes