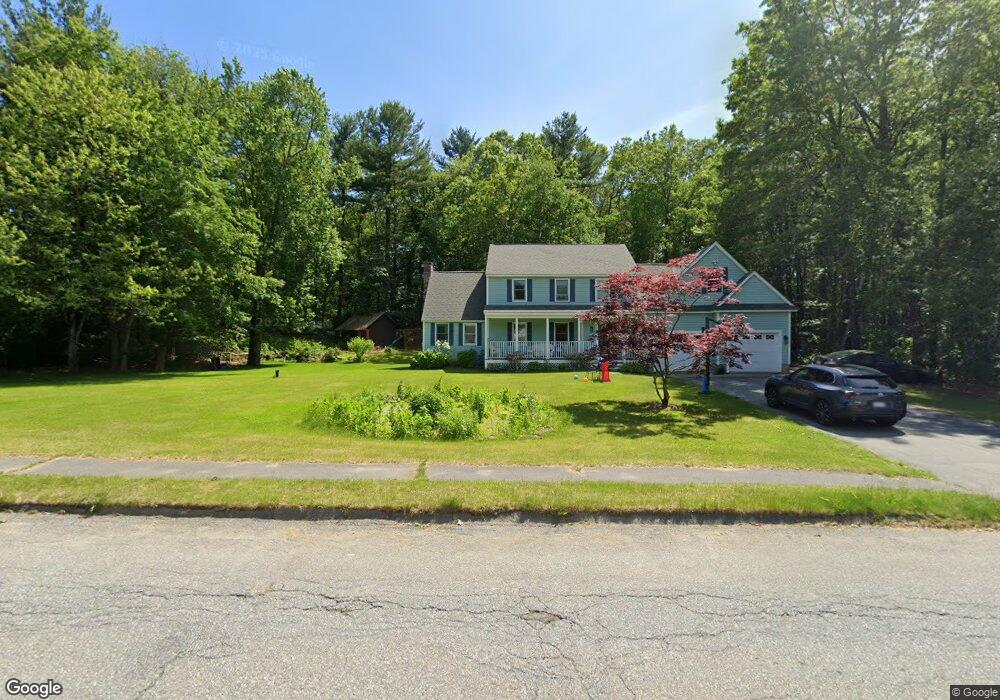
26 Sequoia Rd Tyngsboro, MA 01879
Estimated Value: $898,142 - $1,110,000
4
Beds
3
Baths
3,572
Sq Ft
$278/Sq Ft
Est. Value
About This Home
This home is located at 26 Sequoia Rd, Tyngsboro, MA 01879 and is currently estimated at $994,286, approximately $278 per square foot. 26 Sequoia Rd is a home located in Middlesex County with nearby schools including Tyngsborough Elementary School, Tyngsborough Middle School, and Tyngsborough High School.
Ownership History
Date
Name
Owned For
Owner Type
Purchase Details
Closed on
Feb 28, 2022
Sold by
Miller Diane L and Miller Mark D
Bought by
Khan Mohammed S
Current Estimated Value
Home Financials for this Owner
Home Financials are based on the most recent Mortgage that was taken out on this home.
Original Mortgage
$640,000
Outstanding Balance
$589,734
Interest Rate
3.55%
Mortgage Type
Purchase Money Mortgage
Estimated Equity
$404,552
Purchase Details
Closed on
Apr 28, 1994
Sold by
Sequoia Drive Dev Co
Bought by
Miller Mark D and Miller Diane
Create a Home Valuation Report for This Property
The Home Valuation Report is an in-depth analysis detailing your home's value as well as a comparison with similar homes in the area
Home Values in the Area
Average Home Value in this Area
Purchase History
| Date | Buyer | Sale Price | Title Company |
|---|---|---|---|
| Khan Mohammed S | $800,000 | None Available | |
| Miller Mark D | $187,600 | -- | |
| Miller Mark D | $187,600 | -- |
Source: Public Records
Mortgage History
| Date | Status | Borrower | Loan Amount |
|---|---|---|---|
| Open | Khan Mohammed S | $640,000 | |
| Previous Owner | Miller Mark D | $246,436 | |
| Previous Owner | Miller Mark D | $252,767 |
Source: Public Records
Tax History
| Year | Tax Paid | Tax Assessment Tax Assessment Total Assessment is a certain percentage of the fair market value that is determined by local assessors to be the total taxable value of land and additions on the property. | Land | Improvement |
|---|---|---|---|---|
| 2025 | $100 | $811,100 | $267,400 | $543,700 |
| 2024 | $9,920 | $779,900 | $260,800 | $519,100 |
| 2023 | $9,467 | $669,500 | $217,200 | $452,300 |
| 2022 | $9,091 | $608,500 | $188,900 | $419,600 |
| 2021 | $8,916 | $554,800 | $171,500 | $383,300 |
| 2020 | $8,795 | $541,200 | $162,800 | $378,400 |
| 2019 | $8,421 | $497,400 | $154,100 | $343,300 |
| 2018 | $8,262 | $482,900 | $154,100 | $328,800 |
| 2017 | $7,973 | $464,600 | $154,100 | $310,500 |
| 2016 | $7,633 | $434,700 | $154,100 | $280,600 |
| 2015 | $7,298 | $430,300 | $149,700 | $280,600 |
Source: Public Records
Map
Nearby Homes
- 4 Mascuppic Trail
- 12 Lands-End Rd
- 27 Beech St
- 12 Trotting Park Rd
- 1 Elm Grove Ave
- 22 Juniper Ln Unit 66
- 28 Juniper Ln Unit 65
- 11 Juniper Ln Unit 14
- 30 Tamarack Way Unit 30
- 3 Bridgeview Cir Unit 45
- 21 Merrimac Way Unit D
- 24 Old Tyng Rd
- 27 Tyng Rd
- 75 Frost Rd
- 70 Faith Ave
- 14 Centercrest Dr Unit 14
- 56 Frost Rd
- 1461 Pawtucket Blvd Unit 12
- 221 Wellman Ave
- 1401 Pawtucket Blvd Unit 10
Your Personal Tour Guide
Ask me questions while you tour the home.