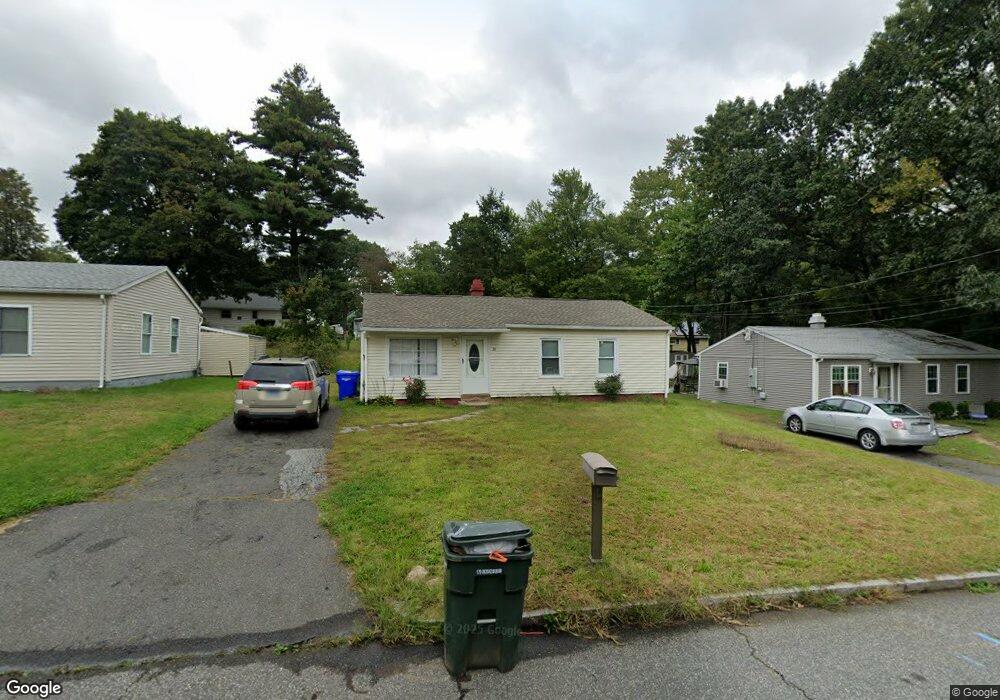
26 Shelby St Springfield, MA 01109
Pine Point NeighborhoodEstimated Value: $250,000 - $262,000
3
Beds
1
Bath
925
Sq Ft
$277/Sq Ft
Est. Value
About This Home
This home is located at 26 Shelby St, Springfield, MA 01109 and is currently estimated at $256,042, approximately $276 per square foot. 26 Shelby St is a home located in Hampden County with nearby schools including Thomas M Balliet Elementary School, John J Duggan Middle, and Roger L. Putnam Vocational Technical Academy.
Ownership History
Date
Name
Owned For
Owner Type
Purchase Details
Closed on
Feb 18, 2005
Sold by
Investment Prop Grp In
Bought by
Amarty Kojo
Current Estimated Value
Home Financials for this Owner
Home Financials are based on the most recent Mortgage that was taken out on this home.
Original Mortgage
$109,000
Outstanding Balance
$55,512
Interest Rate
5.78%
Mortgage Type
Purchase Money Mortgage
Estimated Equity
$200,530
Purchase Details
Closed on
Feb 27, 2004
Sold by
Paul T Cummings T and Cummings Paul T
Bought by
Investment Property Gr
Create a Home Valuation Report for This Property
The Home Valuation Report is an in-depth analysis detailing your home's value as well as a comparison with similar homes in the area
Home Values in the Area
Average Home Value in this Area
Purchase History
| Date | Buyer | Sale Price | Title Company |
|---|---|---|---|
| Amarty Kojo | $109,000 | -- | |
| Investment Property Gr | $350,000 | -- |
Source: Public Records
Mortgage History
| Date | Status | Borrower | Loan Amount |
|---|---|---|---|
| Open | Amarty Kojo | $109,000 |
Source: Public Records
Tax History Compared to Growth
Tax History
| Year | Tax Paid | Tax Assessment Tax Assessment Total Assessment is a certain percentage of the fair market value that is determined by local assessors to be the total taxable value of land and additions on the property. | Land | Improvement |
|---|---|---|---|---|
| 2025 | $3,105 | $198,000 | $40,500 | $157,500 |
| 2024 | $3,010 | $187,400 | $33,800 | $153,600 |
| 2023 | $2,259 | $132,500 | $30,700 | $101,800 |
| 2022 | $2,445 | $129,900 | $28,700 | $101,200 |
| 2021 | $2,088 | $110,500 | $26,100 | $84,400 |
| 2020 | $2,193 | $112,300 | $26,100 | $86,200 |
| 2019 | $2,015 | $102,400 | $26,100 | $76,300 |
| 2018 | $1,887 | $95,900 | $26,100 | $69,800 |
| 2017 | $1,911 | $97,200 | $24,100 | $73,100 |
| 2016 | $1,783 | $90,700 | $24,100 | $66,600 |
| 2015 | $1,629 | $82,800 | $24,100 | $58,700 |
Source: Public Records
Map
Nearby Homes