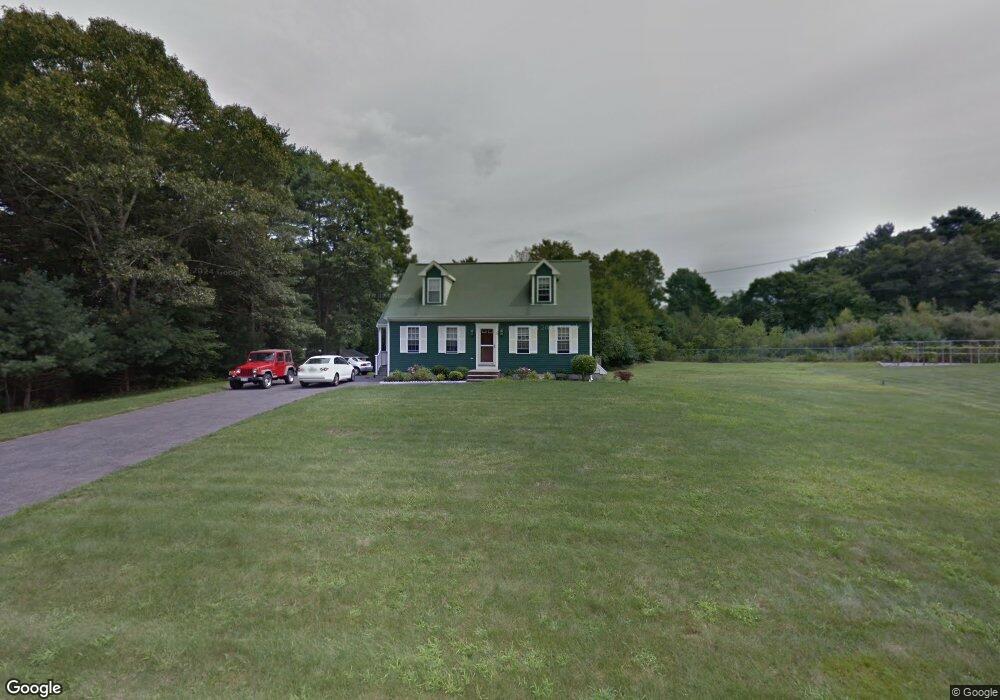
26 Siamese Ave Acushnet, MA 02743
Upper Acushnet NeighborhoodEstimated Value: $560,571 - $628,000
Studio
2
Baths
1,770
Sq Ft
$341/Sq Ft
Est. Value
About This Home
This home is located at 26 Siamese Ave, Acushnet, MA 02743 and is currently estimated at $603,143, approximately $340 per square foot. 26 Siamese Ave is a home located in Bristol County with nearby schools including Acushnet Elementary School, Albert F Ford Middle School, and St Francis Xavier Elementary School.
Ownership History
Date
Name
Owned For
Owner Type
Purchase Details
Closed on
Feb 11, 2004
Sold by
Parent Scott D and Parent Valerie L
Bought by
Parent Valerie L
Current Estimated Value
Purchase Details
Closed on
Jan 13, 1999
Sold by
Angora Ave Rt and Pereira Antonio J
Bought by
Parent Scott D and Parent Valerie L
Home Financials for this Owner
Home Financials are based on the most recent Mortgage that was taken out on this home.
Original Mortgage
$154,350
Interest Rate
6.7%
Mortgage Type
Purchase Money Mortgage
Create a Home Valuation Report for This Property
The Home Valuation Report is an in-depth analysis detailing your home's value as well as a comparison with similar homes in the area
Home Values in the Area
Average Home Value in this Area
Purchase History
| Date | Buyer | Sale Price | Title Company |
|---|---|---|---|
| Parent Valerie L | -- | -- | |
| Parent Scott D | $149,900 | -- |
Source: Public Records
Mortgage History
| Date | Status | Borrower | Loan Amount |
|---|---|---|---|
| Open | Parent Scott D | $181,000 | |
| Previous Owner | Parent Scott D | $154,350 |
Source: Public Records
Tax History
| Year | Tax Paid | Tax Assessment Tax Assessment Total Assessment is a certain percentage of the fair market value that is determined by local assessors to be the total taxable value of land and additions on the property. | Land | Improvement |
|---|---|---|---|---|
| 2025 | $57 | $532,200 | $155,100 | $377,100 |
| 2024 | $5,556 | $486,900 | $146,600 | $340,300 |
| 2023 | $5,501 | $458,400 | $126,900 | $331,500 |
| 2022 | $5,467 | $412,000 | $121,200 | $290,800 |
| 2021 | $5,037 | $364,200 | $121,200 | $243,000 |
| 2020 | $5,077 | $364,200 | $121,200 | $243,000 |
| 2019 | $5,004 | $352,900 | $124,000 | $228,900 |
| 2018 | $4,851 | $336,400 | $124,000 | $212,400 |
| 2017 | $4,676 | $323,800 | $124,000 | $199,800 |
| 2016 | $4,637 | $319,100 | $115,600 | $203,500 |
| 2015 | $4,257 | $298,100 | $115,600 | $182,500 |
Source: Public Records
Map
Nearby Homes
Your Personal Tour Guide
Ask me questions while you tour the home.