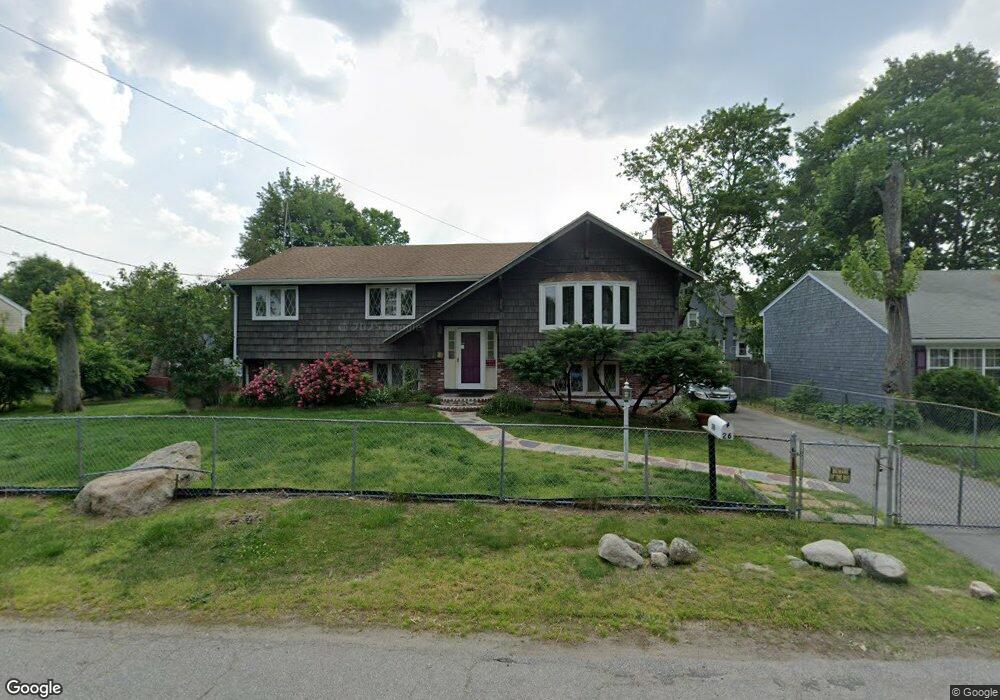
26 Simeon Ave Brockton, MA 02302
Campello NeighborhoodEstimated Value: $575,000 - $606,664
3
Beds
3
Baths
2,030
Sq Ft
$292/Sq Ft
Est. Value
About This Home
This home is located at 26 Simeon Ave, Brockton, MA 02302 and is currently estimated at $592,416, approximately $291 per square foot. 26 Simeon Ave is a home located in Plymouth County with nearby schools including Davis K-8 School, John F. Kennedy Elementary School, and South Middle School.
Ownership History
Date
Name
Owned For
Owner Type
Purchase Details
Closed on
Aug 1, 1995
Sold by
Wilson Clement A
Bought by
Askerneese Mala D and Askerneese Everett
Current Estimated Value
Home Financials for this Owner
Home Financials are based on the most recent Mortgage that was taken out on this home.
Original Mortgage
$103,300
Interest Rate
7.56%
Mortgage Type
Purchase Money Mortgage
Create a Home Valuation Report for This Property
The Home Valuation Report is an in-depth analysis detailing your home's value as well as a comparison with similar homes in the area
Home Values in the Area
Average Home Value in this Area
Purchase History
| Date | Buyer | Sale Price | Title Company |
|---|---|---|---|
| Askerneese Mala D | $106,500 | -- |
Source: Public Records
Mortgage History
| Date | Status | Borrower | Loan Amount |
|---|---|---|---|
| Closed | Askerneese Mala D | $103,300 |
Source: Public Records
Tax History Compared to Growth
Tax History
| Year | Tax Paid | Tax Assessment Tax Assessment Total Assessment is a certain percentage of the fair market value that is determined by local assessors to be the total taxable value of land and additions on the property. | Land | Improvement |
|---|---|---|---|---|
| 2025 | $6,229 | $514,400 | $161,100 | $353,300 |
| 2024 | $6,066 | $504,700 | $161,100 | $343,600 |
| 2023 | $5,875 | $452,600 | $111,500 | $341,100 |
| 2022 | $5,317 | $380,600 | $101,300 | $279,300 |
| 2021 | $5,137 | $354,300 | $94,400 | $259,900 |
| 2020 | $5,071 | $334,700 | $82,700 | $252,000 |
| 2019 | $4,867 | $313,200 | $79,100 | $234,100 |
| 2018 | $4,603 | $286,600 | $79,100 | $207,500 |
| 2017 | $4,352 | $270,300 | $79,100 | $191,200 |
| 2016 | $4,185 | $241,100 | $75,400 | $165,700 |
| 2015 | $3,920 | $216,000 | $75,400 | $140,600 |
| 2014 | $3,668 | $202,300 | $75,400 | $126,900 |
Source: Public Records
Map
Nearby Homes
- 28 Wallace St
- 112 Hillside Ave
- 34 Carl Ave
- 44 Baker St
- 54 Ferris Ave
- 12 Paulin Ave
- 70 Carlisle St
- 265 Summer St
- 16 Yuba Cir
- 74 Oakland St
- 229 Sinclair Rd
- 34 Oakland St
- 163 S Leyden St
- 221 Sinclair Rd
- 223 Clinton St Unit 10
- 223 Clinton St Unit 3
- 103 Clinton St
- 24 Ithica Rd
- 597 East St
- 122 Sinclair Rd