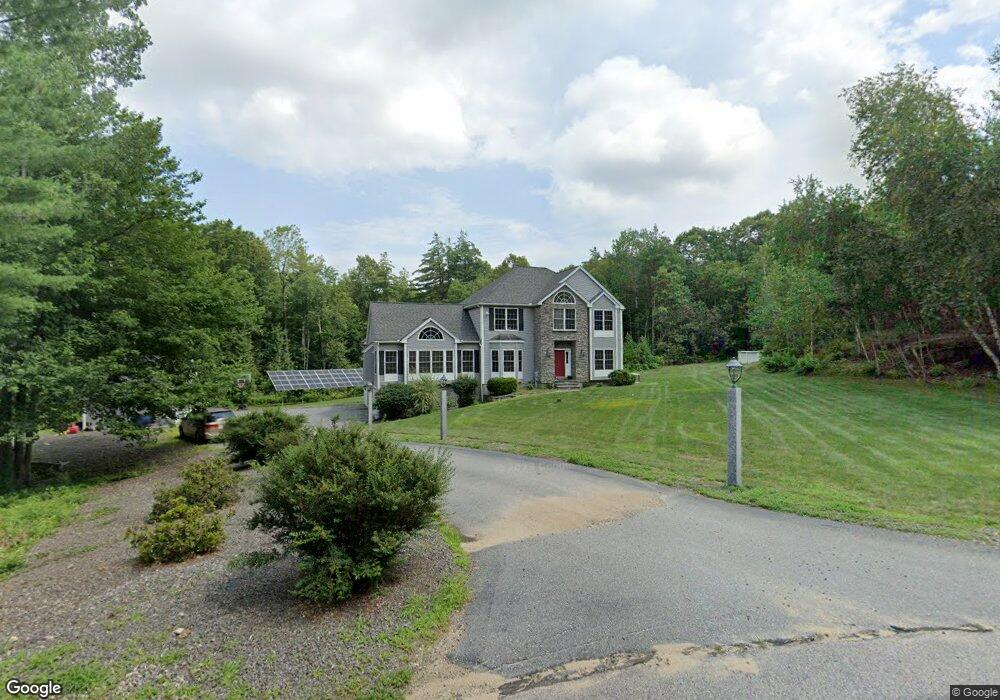
26 Simpson Rd Windham, NH 03087
Estimated Value: $880,000 - $1,329,000
3
Beds
3
Baths
3,184
Sq Ft
$338/Sq Ft
Est. Value
About This Home
This home is located at 26 Simpson Rd, Windham, NH 03087 and is currently estimated at $1,076,309, approximately $338 per square foot. 26 Simpson Rd is a home located in Rockingham County with nearby schools including Golden Brook Elementary School, Windham Middle School, and Windham High School.
Ownership History
Date
Name
Owned For
Owner Type
Purchase Details
Closed on
Jun 2, 2006
Sold by
Seaverns Mark D
Bought by
Burton Gregory D and Burton Julie
Current Estimated Value
Purchase Details
Closed on
May 2, 2002
Sold by
Pelco Land Holding Llc
Bought by
Seaverns Mark D
Create a Home Valuation Report for This Property
The Home Valuation Report is an in-depth analysis detailing your home's value as well as a comparison with similar homes in the area
Home Values in the Area
Average Home Value in this Area
Purchase History
| Date | Buyer | Sale Price | Title Company |
|---|---|---|---|
| Burton Gregory D | $615,000 | -- | |
| Seaverns Mark D | $440,000 | -- |
Source: Public Records
Mortgage History
| Date | Status | Borrower | Loan Amount |
|---|---|---|---|
| Open | Seaverns Mark D | $372,500 | |
| Closed | Seaverns Mark D | $36,377 | |
| Closed | Seaverns Mark D | $388,800 |
Source: Public Records
Tax History
| Year | Tax Paid | Tax Assessment Tax Assessment Total Assessment is a certain percentage of the fair market value that is determined by local assessors to be the total taxable value of land and additions on the property. | Land | Improvement |
|---|---|---|---|---|
| 2024 | $14,716 | $650,000 | $191,000 | $459,000 |
| 2023 | $13,910 | $650,000 | $191,000 | $459,000 |
| 2022 | $12,844 | $650,000 | $191,000 | $459,000 |
| 2021 | $12,196 | $655,000 | $191,000 | $464,000 |
| 2020 | $12,530 | $655,000 | $191,000 | $464,000 |
| 2019 | $11,703 | $519,000 | $175,900 | $343,100 |
| 2018 | $12,088 | $519,000 | $175,900 | $343,100 |
| 2017 | $10,484 | $519,000 | $175,900 | $343,100 |
| 2016 | $11,325 | $519,000 | $175,900 | $343,100 |
| 2015 | $10,276 | $473,100 | $190,000 | $283,100 |
| 2014 | $10,954 | $456,400 | $190,000 | $266,400 |
| 2013 | $11,172 | $473,400 | $190,000 | $283,400 |
Source: Public Records
Map
Nearby Homes
- 45 Sharon Rd
- 229 Range Rd
- 48 Marblehead Rd
- 2 Baker Rd
- 47 Cobbetts Pond Rd
- 17 Gordon Ave
- 23 Ryan Farm Rd
- 2 Cypress Ln
- 7 Cypress Ln Unit 5
- 4 Cypress Ln Unit 10
- 47 Campbell St
- 1109 Mammoth Rd Unit A
- 45 Hobbs Rd
- 11 Venus Way
- 6 Chadwick Cir
- 6 Yellow Wood Dr
- 6-18 Mary Anthony Dr
- 30 Winter St
- 108 S Shore Rd
- 4 Arbor Rd
- 21 Simpson Rd
- 24 Simpson Rd
- 13 Princeton St
- 11 Princeton St
- 15 Princeton St
- 19 Simpson Rd
- 22 Simpson Rd
- 19 Princeton St
- 14 Candlewood Rd
- 20 Simpson Rd
- 12 Candlewood Rd
- 14 Princeton St
- 21 Princeton St
- 9 Princeton St
- 6 Candlewood Rd
- 12 Princeton St
- 18 Simpson Rd
- 51 Sharon Rd
- 16 Princeton St
- 49 Sharon Rd