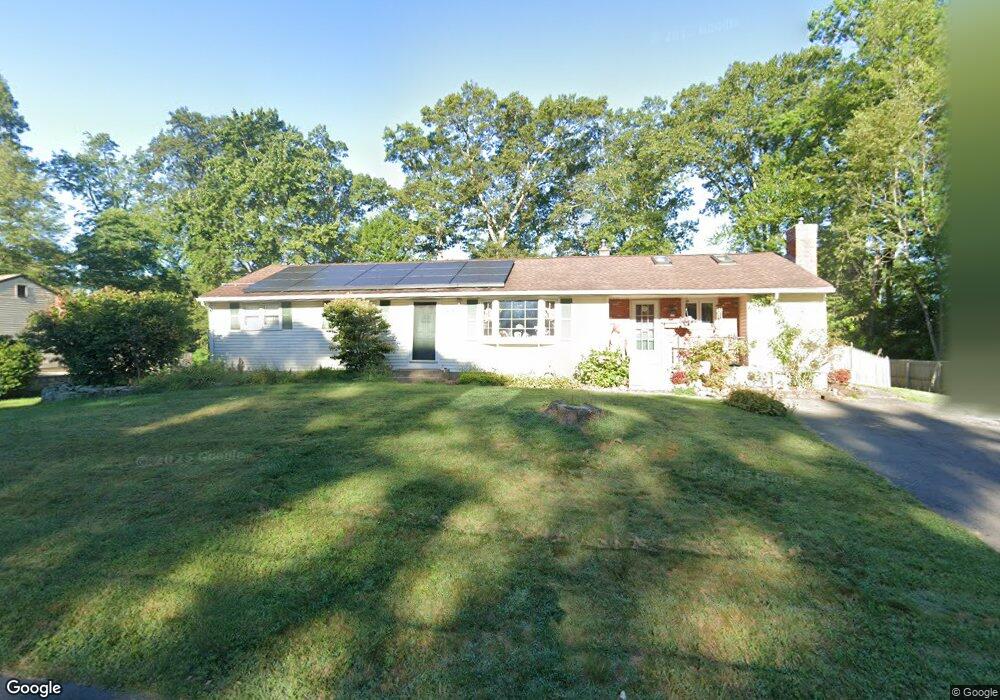
26 Standish St Enfield, CT 06082
Estimated Value: $318,000 - $338,051
3
Beds
1
Bath
1,497
Sq Ft
$219/Sq Ft
Est. Value
About This Home
This home is located at 26 Standish St, Enfield, CT 06082 and is currently estimated at $328,513, approximately $219 per square foot. 26 Standish St is a home located in Hartford County with nearby schools including Edgar H. Parkman School, Enfield Street Elementary School, and John F. Kennedy Middle School.
Ownership History
Date
Name
Owned For
Owner Type
Purchase Details
Closed on
Jul 11, 2007
Sold by
Fosberg Catherine
Bought by
Leahy Kevin
Current Estimated Value
Purchase Details
Closed on
May 5, 2005
Sold by
Fisher John and Fisher Kristen
Bought by
Fosberg Catherine
Purchase Details
Closed on
Sep 27, 2001
Sold by
Department Of Housing & Urban Dev
Bought by
Fisher John and Versteeg Kristen
Purchase Details
Closed on
Aug 2, 1993
Sold by
Colli Keith
Bought by
Wilson Jennifer and Reynolds Susan
Create a Home Valuation Report for This Property
The Home Valuation Report is an in-depth analysis detailing your home's value as well as a comparison with similar homes in the area
Home Values in the Area
Average Home Value in this Area
Purchase History
| Date | Buyer | Sale Price | Title Company |
|---|---|---|---|
| Leahy Kevin | $190,000 | -- | |
| Fosberg Catherine | $199,900 | -- | |
| Fisher John | $121,357 | -- | |
| Wilson Jennifer | $129,000 | -- |
Source: Public Records
Mortgage History
| Date | Status | Borrower | Loan Amount |
|---|---|---|---|
| Open | Wilson Jennifer | $17,100 | |
| Open | Wilson Jennifer | $174,124 |
Source: Public Records
Tax History Compared to Growth
Tax History
| Year | Tax Paid | Tax Assessment Tax Assessment Total Assessment is a certain percentage of the fair market value that is determined by local assessors to be the total taxable value of land and additions on the property. | Land | Improvement |
|---|---|---|---|---|
| 2025 | $5,528 | $158,000 | $58,200 | $99,800 |
| 2024 | $5,380 | $158,000 | $58,200 | $99,800 |
| 2023 | $5,340 | $158,000 | $58,200 | $99,800 |
| 2022 | $4,849 | $158,000 | $58,200 | $99,800 |
| 2021 | $4,761 | $126,850 | $48,240 | $78,610 |
| 2020 | $4,761 | $126,850 | $48,240 | $78,610 |
| 2019 | $4,773 | $126,850 | $48,240 | $78,610 |
| 2018 | $4,693 | $126,850 | $48,240 | $78,610 |
| 2017 | $4,431 | $126,850 | $48,240 | $78,610 |
| 2016 | $4,328 | $126,130 | $49,500 | $76,630 |
| 2015 | $4,193 | $126,130 | $49,500 | $76,630 |
| 2014 | $4,084 | $126,130 | $49,500 | $76,630 |
Source: Public Records
Map
Nearby Homes