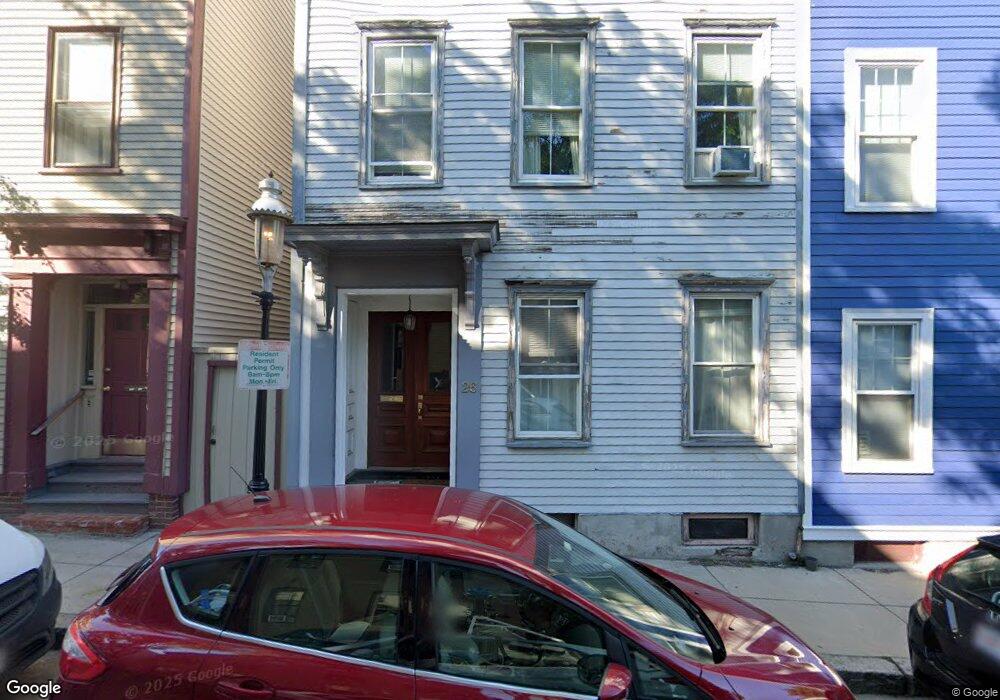
26 Tremont St Charlestown, MA 02129
Thompson Square-Bunker Hill NeighborhoodEstimated Value: $1,709,000 - $2,048,000
5
Beds
3
Baths
3,030
Sq Ft
$615/Sq Ft
Est. Value
About This Home
This home is located at 26 Tremont St, Charlestown, MA 02129 and is currently estimated at $1,863,333, approximately $614 per square foot. 26 Tremont St is a home located in Suffolk County with nearby schools including Prospect Hill Academy Upper Elementary Campus and Boston Children's School.
Ownership History
Date
Name
Owned For
Owner Type
Purchase Details
Closed on
May 11, 1990
Sold by
Mazur Maria
Bought by
Porter Bradley A
Current Estimated Value
Home Financials for this Owner
Home Financials are based on the most recent Mortgage that was taken out on this home.
Original Mortgage
$171,000
Interest Rate
10.15%
Mortgage Type
Purchase Money Mortgage
Create a Home Valuation Report for This Property
The Home Valuation Report is an in-depth analysis detailing your home's value as well as a comparison with similar homes in the area
Home Values in the Area
Average Home Value in this Area
Purchase History
| Date | Buyer | Sale Price | Title Company |
|---|---|---|---|
| Porter Bradley A | $190,000 | -- |
Source: Public Records
Mortgage History
| Date | Status | Borrower | Loan Amount |
|---|---|---|---|
| Open | Porter Bradley A | $200,000 | |
| Closed | Porter Bradley A | $233,000 | |
| Closed | Porter Bradley A | $45,000 | |
| Closed | Porter Bradley A | $171,000 |
Source: Public Records
Tax History Compared to Growth
Tax History
| Year | Tax Paid | Tax Assessment Tax Assessment Total Assessment is a certain percentage of the fair market value that is determined by local assessors to be the total taxable value of land and additions on the property. | Land | Improvement |
|---|---|---|---|---|
| 2025 | $16,360 | $1,412,800 | $407,100 | $1,005,700 |
| 2024 | $14,638 | $1,342,900 | $345,100 | $997,800 |
| 2023 | $13,738 | $1,279,100 | $328,700 | $950,400 |
| 2022 | $13,007 | $1,195,500 | $307,200 | $888,300 |
| 2021 | $12,385 | $1,160,700 | $298,300 | $862,400 |
| 2020 | $10,618 | $1,005,500 | $295,600 | $709,900 |
| 2019 | $9,637 | $914,300 | $221,600 | $692,700 |
| 2018 | $9,124 | $870,600 | $221,600 | $649,000 |
| 2017 | $8,780 | $829,100 | $221,600 | $607,500 |
| 2016 | $8,291 | $753,700 | $221,600 | $532,100 |
| 2015 | $7,830 | $646,600 | $285,800 | $360,800 |
| 2014 | $7,318 | $581,700 | $285,800 | $295,900 |
Source: Public Records
Map
Nearby Homes
- 106 Bunker Hill St Unit 2
- 106 Bunker Hill St Unit 6
- 106 Bunker Hill St Unit 1
- 106 Bunker Hill St Unit 4P
- 106 Bunker Hill St Unit 3
- 172 Bunker Hill St Unit 1
- 5 Wallace Ct
- 207 Bunker Hill St Unit 2
- 12 Prospect St Unit 2
- 12 Prospect St Unit 1
- 56 High St Unit 3
- 46 High St
- 254-256 Medford St Unit 2
- 247 Bunker Hill St Unit A
- 9 Russell St Unit 2
- 9 Russell St Unit 1
- 73 Chelsea St Unit 401
- 255 Bunker Hill St Unit 2
- 15 Russell St
- 17 Henley St Unit F
- 28 Tremont St Unit 3
- 28 Tremont St Unit 28A
- 28 Tremont St Unit 2
- 30 Tremont St Unit 2
- 30 Tremont St Unit 30A
- 30 Tremont St Unit 107
- 30 Tremont St Unit 1
- 30 Tremont St Unit 3
- 26 Tremont St Unit 2
- 26 Tremont St Unit 3
- 32 Tremont St Unit 32A
- 22 Tremont St
- 22 Tremont St Unit 1
- 22 Tremont St Unit 2
- 34 Tremont St Unit 34A
- 34 Tremont St Unit 1
- 34 Tremont St Unit 2
- 34 Tremont St Unit 3
- 20 Tremont St
- 18 Tremont St