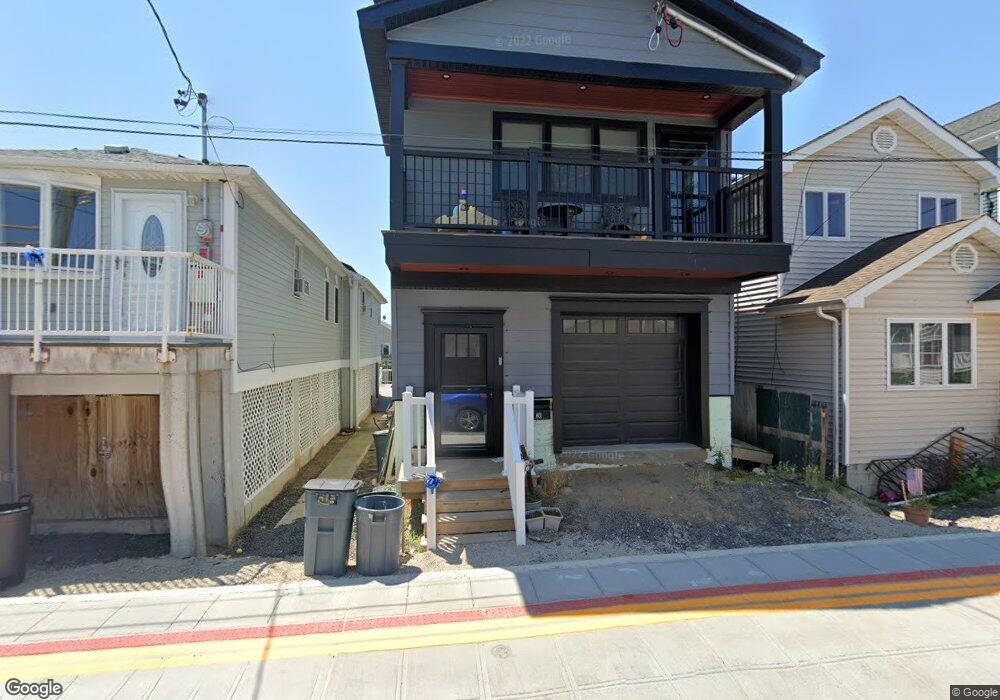
26 W 15th Rd Broad Channel, NY 11693
Broad Channel NeighborhoodEstimated Value: $569,053 - $734,000
--
Bed
--
Bath
1,700
Sq Ft
$394/Sq Ft
Est. Value
About This Home
This home is located at 26 W 15th Rd, Broad Channel, NY 11693 and is currently estimated at $670,013, approximately $394 per square foot. 26 W 15th Rd is a home located in Queens County with nearby schools including P.S. 47 - Chris Galas and St Rose of Lima Catholic Academy.
Ownership History
Date
Name
Owned For
Owner Type
Purchase Details
Closed on
Jul 25, 2018
Sold by
Kelly John T and Kelly Patricia A
Bought by
Kelly Linda Marie Porcheddu and Kelly Patrick D
Current Estimated Value
Home Financials for this Owner
Home Financials are based on the most recent Mortgage that was taken out on this home.
Original Mortgage
$530,844
Outstanding Balance
$461,073
Interest Rate
4.6%
Mortgage Type
New Conventional
Estimated Equity
$208,940
Purchase Details
Closed on
Apr 3, 1998
Sold by
Szwaba Henry and Szwaba Melody
Bought by
Kelly John T and Kelly Patricia A
Home Financials for this Owner
Home Financials are based on the most recent Mortgage that was taken out on this home.
Original Mortgage
$159,300
Interest Rate
7.11%
Mortgage Type
Purchase Money Mortgage
Purchase Details
Closed on
Mar 26, 1984
Sold by
City Of New York
Bought by
Hogan Barbara
Create a Home Valuation Report for This Property
The Home Valuation Report is an in-depth analysis detailing your home's value as well as a comparison with similar homes in the area
Home Values in the Area
Average Home Value in this Area
Purchase History
| Date | Buyer | Sale Price | Title Company |
|---|---|---|---|
| Kelly Linda Marie Porcheddu | $150,000 | -- | |
| Kelly John T | $177,000 | Stewart Title Insurance Co | |
| Hogan Barbara | -- | -- |
Source: Public Records
Mortgage History
| Date | Status | Borrower | Loan Amount |
|---|---|---|---|
| Open | Kelly Linda Marie Porcheddu | $530,844 | |
| Previous Owner | Kelly John T | $159,300 |
Source: Public Records
Tax History Compared to Growth
Tax History
| Year | Tax Paid | Tax Assessment Tax Assessment Total Assessment is a certain percentage of the fair market value that is determined by local assessors to be the total taxable value of land and additions on the property. | Land | Improvement |
|---|---|---|---|---|
| 2025 | $3,742 | $18,631 | $3,532 | $15,099 |
| 2024 | $1,745 | $18,630 | $3,732 | $14,898 |
| 2023 | $3,713 | $18,486 | $3,846 | $14,640 |
| 2022 | $1,485 | $30,840 | $7,440 | $23,400 |
| 2021 | $3,463 | $25,560 | $7,440 | $18,120 |
| 2020 | $3,286 | $25,080 | $7,440 | $17,640 |
| 2019 | $3,248 | $21,480 | $7,440 | $14,040 |
| 2018 | $3,140 | $15,405 | $5,205 | $10,200 |
| 2017 | $2,963 | $14,534 | $6,088 | $8,446 |
| 2016 | $2,741 | $14,534 | $6,088 | $8,446 |
| 2015 | $1,434 | $12,938 | $5,650 | $7,288 |
| 2014 | $1,434 | $12,938 | $5,650 | $7,288 |
Source: Public Records
Map
Nearby Homes
- 21 W 18th Rd
- 20 W 18th Rd
- 12 W 14th Rd
- 14-7 Cross Bay Blvd
- 1317 Cross Bay Blvd
- 12-38 Cross Bay Blvd
- 1234 Cross Bay Blvd
- 12-34 Cross Bay Blvd
- 33 W 12th Rd
- 1024 Cross Bay Blvd
- 21 Van Brunt Rd
- 27 W 11th Rd
- 33 W 11th Rd
- 35 W 11th Rd
- 22 W 10th Rd
- 20 W 10th Rd
- 803 Cross Bay Blvd
- 815 Walton Rd
- 120 E 8th Rd
- 621 Cross Bay Blvd