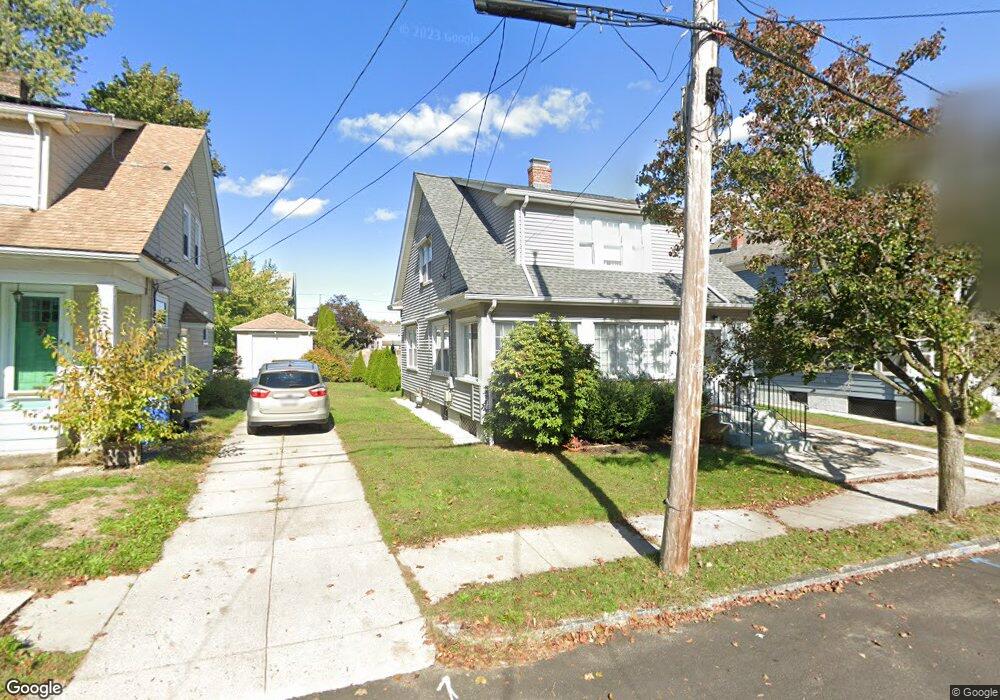
26 Welfare Ave Cranston, RI 02910
Estimated Value: $316,000 - $442,000
3
Beds
1
Bath
1,280
Sq Ft
$297/Sq Ft
Est. Value
About This Home
This home is located at 26 Welfare Ave, Cranston, RI 02910 and is currently estimated at $380,503, approximately $297 per square foot. 26 Welfare Ave is a home located in Providence County with nearby schools including W. R. Dutemple School, Park View Middle School, and Cranston High School East.
Ownership History
Date
Name
Owned For
Owner Type
Purchase Details
Closed on
Oct 3, 2025
Sold by
Handy Arthur B
Bought by
Summit Propertt Partners
Current Estimated Value
Purchase Details
Closed on
Oct 29, 1999
Sold by
Harris Ellen D
Bought by
Handy Arthur B and Diprete Patricia
Create a Home Valuation Report for This Property
The Home Valuation Report is an in-depth analysis detailing your home's value as well as a comparison with similar homes in the area
Purchase History
| Date | Buyer | Sale Price | Title Company |
|---|---|---|---|
| Summit Propertt Partners | $300,000 | -- | |
| Handy Arthur B | $78,500 | -- |
Source: Public Records
Mortgage History
| Date | Status | Borrower | Loan Amount |
|---|---|---|---|
| Previous Owner | Handy Arthur B | $83,000 | |
| Previous Owner | Handy Arthur B | $35,000 | |
| Previous Owner | Handy Arthur B | $86,000 |
Source: Public Records
Tax History
| Year | Tax Paid | Tax Assessment Tax Assessment Total Assessment is a certain percentage of the fair market value that is determined by local assessors to be the total taxable value of land and additions on the property. | Land | Improvement |
|---|---|---|---|---|
| 2025 | $4,430 | $319,200 | $106,900 | $212,300 |
| 2024 | $4,344 | $319,200 | $106,900 | $212,300 |
| 2023 | $4,243 | $224,500 | $70,400 | $154,100 |
| 2022 | $4,155 | $224,500 | $70,400 | $154,100 |
| 2021 | $4,041 | $224,500 | $70,400 | $154,100 |
| 2020 | $3,948 | $190,100 | $67,000 | $123,100 |
| 2019 | $3,948 | $190,100 | $67,000 | $123,100 |
| 2018 | $3,857 | $190,100 | $67,000 | $123,100 |
| 2017 | $3,627 | $158,100 | $60,300 | $97,800 |
| 2016 | $3,549 | $158,100 | $60,300 | $97,800 |
| 2015 | $3,549 | $158,100 | $60,300 | $97,800 |
| 2014 | $3,613 | $158,200 | $60,300 | $97,900 |
Source: Public Records
Map
Nearby Homes
- 50 Welfare Ave
- 43 Woodbine St
- 165 Rounds Ave
- 326 Beckwith St
- 90 Garden St
- 288 Pontiac Ave
- 113 Alger Ave
- 140 Eldridge St
- 41 Cottage St
- 31 Burrows St
- 102 Dixon St Unit 12
- 129 Alger Ave
- 125 Alger Ave
- 152 Woodbine St
- 363 Pontiac Ave
- 26 Westmore St
- 99 Dixon St
- 00 Westmore St
- 55 Togansett Rd
- 77 Victory St
Your Personal Tour Guide
Ask me questions while you tour the home.