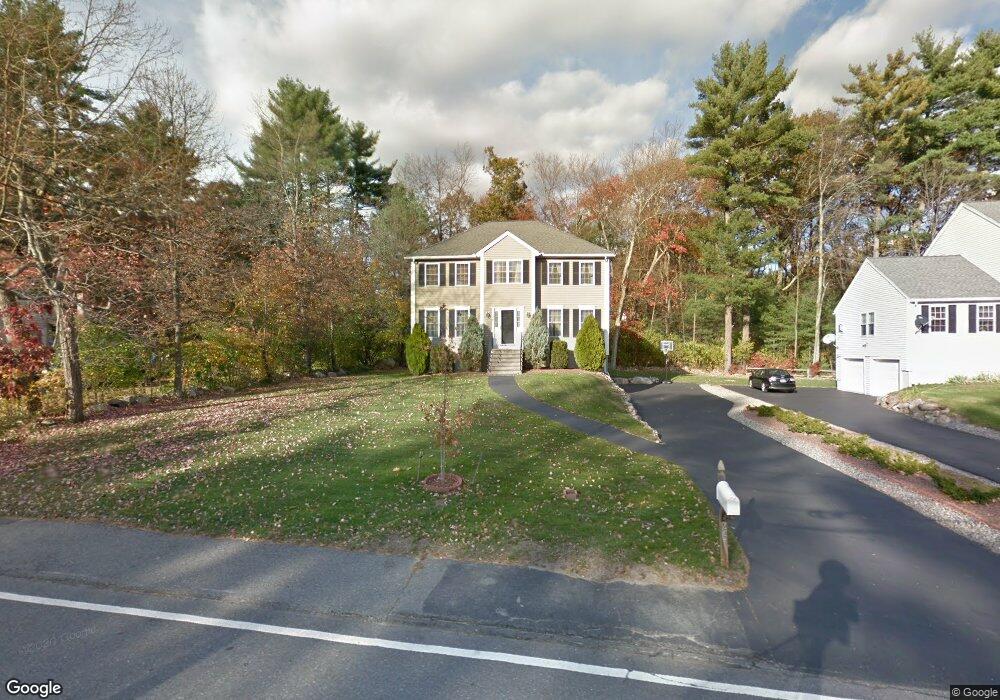
26 Westwood St Burlington, MA 01803
North Burlington NeighborhoodEstimated Value: $1,022,820 - $1,270,000
4
Beds
3
Baths
2,128
Sq Ft
$538/Sq Ft
Est. Value
About This Home
This home is located at 26 Westwood St, Burlington, MA 01803 and is currently estimated at $1,145,205, approximately $538 per square foot. 26 Westwood St is a home located in Middlesex County with nearby schools including Burlington High School, Fox Hill, and Marshall Simonds Middle School.
Ownership History
Date
Name
Owned For
Owner Type
Purchase Details
Closed on
Dec 20, 2022
Sold by
Chiang Pijian and Chiang Pauline
Bought by
Chiang Ft and Chiang
Current Estimated Value
Purchase Details
Closed on
Jul 18, 2003
Sold by
Sullivan Dennis
Bought by
Chiang Pauline and Chiang Pijian
Home Financials for this Owner
Home Financials are based on the most recent Mortgage that was taken out on this home.
Original Mortgage
$310,000
Interest Rate
5.34%
Mortgage Type
Purchase Money Mortgage
Create a Home Valuation Report for This Property
The Home Valuation Report is an in-depth analysis detailing your home's value as well as a comparison with similar homes in the area
Home Values in the Area
Average Home Value in this Area
Purchase History
| Date | Buyer | Sale Price | Title Company |
|---|---|---|---|
| Chiang Ft | -- | None Available | |
| Chiang Pauline | $544,000 | -- | |
| Chiang Pijian | $544,000 | -- |
Source: Public Records
Mortgage History
| Date | Status | Borrower | Loan Amount |
|---|---|---|---|
| Previous Owner | Chiang Pijian | $310,000 |
Source: Public Records
Tax History Compared to Growth
Tax History
| Year | Tax Paid | Tax Assessment Tax Assessment Total Assessment is a certain percentage of the fair market value that is determined by local assessors to be the total taxable value of land and additions on the property. | Land | Improvement |
|---|---|---|---|---|
| 2025 | $7,929 | $915,600 | $425,000 | $490,600 |
| 2024 | $7,804 | $872,900 | $403,000 | $469,900 |
| 2023 | $7,607 | $809,300 | $350,000 | $459,300 |
| 2022 | $7,299 | $733,600 | $319,000 | $414,600 |
| 2021 | $7,011 | $704,600 | $290,000 | $414,600 |
| 2020 | $6,792 | $704,600 | $290,000 | $414,600 |
| 2019 | $6,697 | $639,000 | $271,000 | $368,000 |
| 2018 | $6,648 | $626,000 | $258,000 | $368,000 |
| 2017 | $6,473 | $626,000 | $258,000 | $368,000 |
| 2016 | $6,427 | $560,800 | $220,000 | $340,800 |
| 2015 | $6,365 | $560,800 | $220,000 | $340,800 |
| 2014 | $6,416 | $534,700 | $200,000 | $334,700 |
Source: Public Records
Map
Nearby Homes
- 24 Westwood St
- 28 Westwood St
- 23 Westwood St
- 27 Wheatland St
- 29 Wheatland St
- 21 Westwood St
- 22 Westwood St
- 19 Westwood St
- 25 Wheatland St
- 32 Westwood St
- 25 Westwood St
- 31 Wheatland St
- 17 Westwood St
- 27 Westwood St
- 33 Wheatland St
- 15 Westwood St
- 34 Westwood St
- 17 Wheatland St
- 34 Wheatland St
- 36 Wheatland St