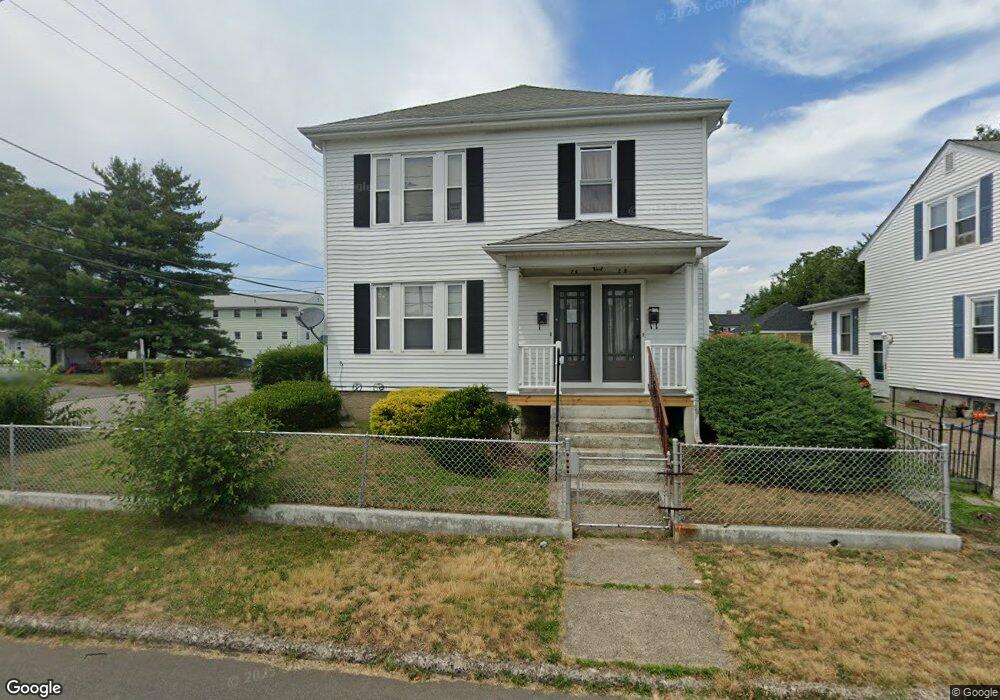
26 Windsor Rd Pawtucket, RI 02861
Darlington NeighborhoodEstimated Value: $465,428 - $664,000
6
Beds
2
Baths
2,368
Sq Ft
$245/Sq Ft
Est. Value
About This Home
This home is located at 26 Windsor Rd, Pawtucket, RI 02861 and is currently estimated at $580,607, approximately $245 per square foot. 26 Windsor Rd is a home located in Providence County with nearby schools including St Cecilia School and Saint Teresa Catholic Elementary School.
Ownership History
Date
Name
Owned For
Owner Type
Purchase Details
Closed on
Sep 15, 2004
Sold by
Charchafliah Jan A
Bought by
Federico Armando
Current Estimated Value
Home Financials for this Owner
Home Financials are based on the most recent Mortgage that was taken out on this home.
Original Mortgage
$200,000
Outstanding Balance
$98,606
Interest Rate
6.02%
Mortgage Type
Purchase Money Mortgage
Estimated Equity
$482,001
Purchase Details
Closed on
Oct 15, 1999
Sold by
Figura Arlene E
Bought by
Charchafliah Jan A
Home Financials for this Owner
Home Financials are based on the most recent Mortgage that was taken out on this home.
Original Mortgage
$125,900
Interest Rate
7.8%
Create a Home Valuation Report for This Property
The Home Valuation Report is an in-depth analysis detailing your home's value as well as a comparison with similar homes in the area
Home Values in the Area
Average Home Value in this Area
Purchase History
| Date | Buyer | Sale Price | Title Company |
|---|---|---|---|
| Federico Armando | $285,000 | -- | |
| Charchafliah Jan A | $140,000 | -- |
Source: Public Records
Mortgage History
| Date | Status | Borrower | Loan Amount |
|---|---|---|---|
| Open | Charchafliah Jan A | $200,000 | |
| Previous Owner | Charchafliah Jan A | $125,900 |
Source: Public Records
Tax History Compared to Growth
Tax History
| Year | Tax Paid | Tax Assessment Tax Assessment Total Assessment is a certain percentage of the fair market value that is determined by local assessors to be the total taxable value of land and additions on the property. | Land | Improvement |
|---|---|---|---|---|
| 2025 | $5,749 | $437,200 | $136,500 | $300,700 |
| 2024 | $5,395 | $437,200 | $136,500 | $300,700 |
| 2023 | $4,985 | $294,300 | $80,900 | $213,400 |
| 2022 | $4,879 | $294,300 | $80,900 | $213,400 |
| 2021 | $4,879 | $294,300 | $80,900 | $213,400 |
| 2020 | $4,594 | $219,900 | $77,500 | $142,400 |
| 2019 | $4,594 | $219,900 | $77,500 | $142,400 |
| 2018 | $4,427 | $219,900 | $77,500 | $142,400 |
| 2017 | $3,812 | $167,800 | $55,600 | $112,200 |
| 2016 | $3,673 | $167,800 | $55,600 | $112,200 |
| 2015 | $3,673 | $167,800 | $55,600 | $112,200 |
| 2014 | $3,581 | $155,300 | $49,700 | $105,600 |
Source: Public Records
Map
Nearby Homes