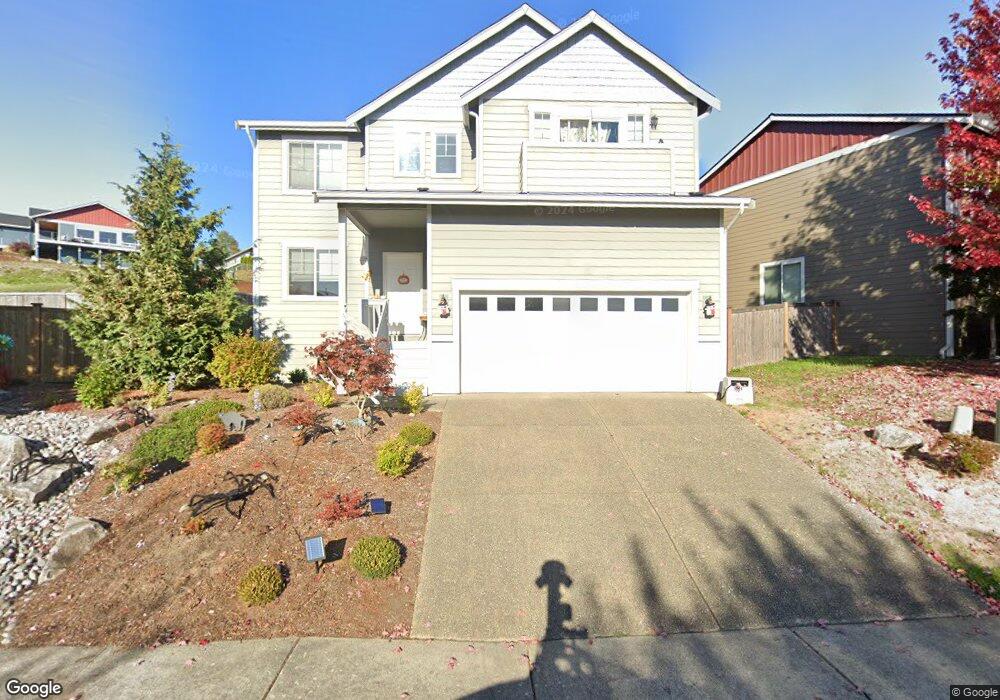
260 E 29th St Bremerton, WA 98310
East Bremerton NeighborhoodEstimated Value: $523,000 - $587,000
3
Beds
3
Baths
2,080
Sq Ft
$267/Sq Ft
Est. Value
About This Home
This home is located at 260 E 29th St, Bremerton, WA 98310 and is currently estimated at $555,508, approximately $267 per square foot. 260 E 29th St is a home located in Kitsap County with nearby schools including Armin Jahr Elementary School, Mountain View Middle School, and Bremerton High School.
Ownership History
Date
Name
Owned For
Owner Type
Purchase Details
Closed on
Apr 25, 2017
Sold by
Egnatios Robyn
Bought by
Egnatios Robyn
Current Estimated Value
Purchase Details
Closed on
Jan 29, 2013
Sold by
Highmark Homes Llc
Bought by
Schultz David E and Egnatios Robyn M
Home Financials for this Owner
Home Financials are based on the most recent Mortgage that was taken out on this home.
Original Mortgage
$179,960
Outstanding Balance
$125,511
Interest Rate
3.36%
Mortgage Type
New Conventional
Estimated Equity
$429,997
Purchase Details
Closed on
Jun 5, 2012
Sold by
Sterling Savings Bank
Bought by
Highmark Homes Llc
Home Financials for this Owner
Home Financials are based on the most recent Mortgage that was taken out on this home.
Original Mortgage
$105,000
Interest Rate
3.74%
Mortgage Type
Purchase Money Mortgage
Purchase Details
Closed on
Mar 24, 2011
Sold by
Camp Corporation
Bought by
Sterling Savings Bank
Create a Home Valuation Report for This Property
The Home Valuation Report is an in-depth analysis detailing your home's value as well as a comparison with similar homes in the area
Home Values in the Area
Average Home Value in this Area
Purchase History
We collect this data history from publicly available records. To have your information removed, we recommend requesting removal directly through your county’s website.
| Date | Buyer | Sale Price | Title Company |
|---|---|---|---|
| Egnatios Robyn | -- | None Available | |
| Schultz David E | $225,230 | First American Title Ins | |
| Highmark Homes Llc | $330,280 | Pacific Nw Title | |
| Sterling Savings Bank | -- | First American Title Ins |
Source: Public Records
Mortgage History
We collect this data history from publicly available records. To have your information removed, we recommend requesting removal directly through your county’s website.
| Date | Status | Borrower | Loan Amount |
|---|---|---|---|
| Open | Schultz David E | $179,960 | |
| Previous Owner | Highmark Homes Llc | $105,000 |
Source: Public Records
Tax History
| Year | Tax Paid | Tax Assessment Tax Assessment Total Assessment is a certain percentage of the fair market value that is determined by local assessors to be the total taxable value of land and additions on the property. | Land | Improvement |
|---|---|---|---|---|
| 2026 | $4,836 | $496,120 | $94,050 | $402,070 |
| 2025 | $4,836 | $496,120 | $94,050 | $402,070 |
| 2024 | $4,670 | $496,120 | $94,050 | $402,070 |
| 2023 | $4,685 | $496,120 | $94,050 | $402,070 |
| 2022 | $4,422 | $414,470 | $78,380 | $336,090 |
| 2021 | $4,012 | $352,560 | $51,360 | $301,200 |
| 2020 | $3,639 | $330,480 | $47,890 | $282,590 |
| 2019 | $3,311 | $298,540 | $43,030 | $255,510 |
| 2018 | $3,869 | $256,370 | $38,560 | $217,810 |
| 2017 | $3,410 | $256,370 | $38,560 | $217,810 |
| 2016 | $3,155 | $225,080 | $33,830 | $191,250 |
| 2015 | $2,874 | $209,810 | $34,260 | $175,550 |
| 2014 | -- | $201,120 | $34,260 | $166,860 |
| 2013 | -- | $55,040 | $43,330 | $11,710 |
Source: Public Records
Map
Nearby Homes
- 3131 Sahali Dr
- 3370 Narrows View Ln NE Unit 202
- 123 Acorn St
- 150 Lebo Blvd
- 119
- 0 Sylvan Way Unit NWM2525060
- 654 E 31st St
- 134 Blackfish Ct
- 2712 Hefner Ave
- 3309 Pine Rd NE
- 2505 -2507 N Wycoff Ave
- 0 XXX Tracyton Beach Rd NW
- 4 Sulphur Springs Ln
- 2540 E Phinney Bay Place
- 213 Willow St
- 2022 Taft Ave
- 64 Pearl Place
- 928 Dibb St
- 2916 Robin Ave
- 1022 Sheridan Rd
- 260 E 29th St
- 266 E 29th St
- 254 E 29th St
- 249 E 29th St
- 272 E 29th St
- 2926 Pawnee Dr
- 2921 Pawnee Dr
- 267 E 29th St
- 261 E 29th St
- 278 E 29th St
- 255 E 29th St
- 2790 Tracyton Beach Rd
- 2790 Tracyton Beach Rd NW
- 2932 Pawnee Dr
- 2999 Gerard Place E
- 284 E 29th St
- 266 E Barlow Ct
- 262 E Barlow Ct E
- 274 E Barlow Ct
- 256 E Barlow Ct E
Your Personal Tour Guide
Ask me questions while you tour the home.