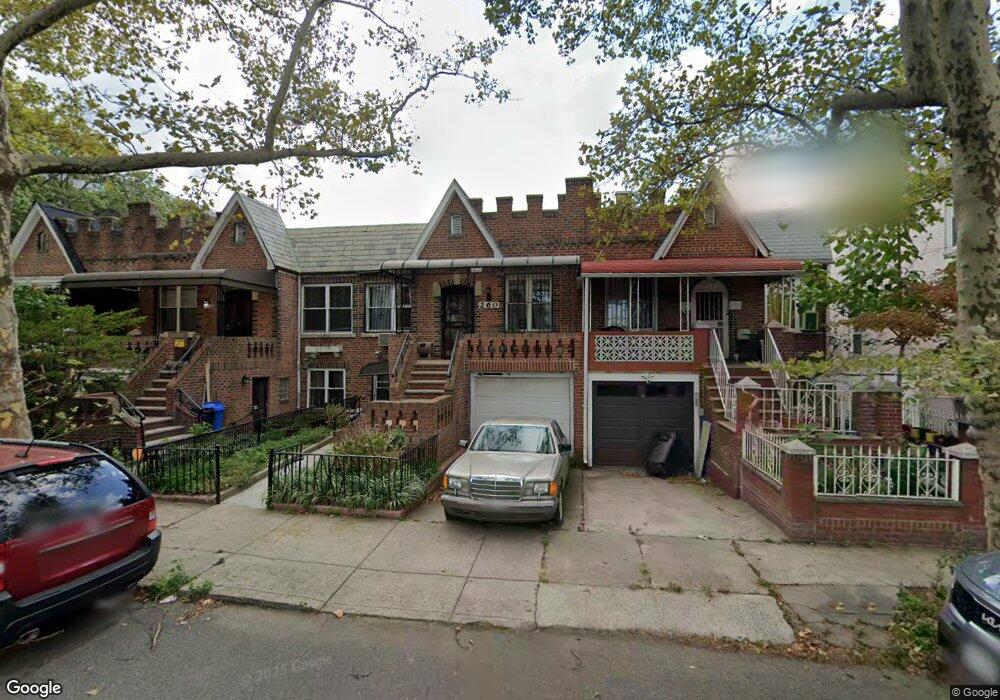
260 E 58th St Brooklyn, NY 11203
East Flatbush NeighborhoodEstimated Value: $628,655 - $757,000
Studio
--
Bath
1,598
Sq Ft
$443/Sq Ft
Est. Value
About This Home
This home is located at 260 E 58th St, Brooklyn, NY 11203 and is currently estimated at $708,164, approximately $443 per square foot. 260 E 58th St is a home located in Kings County with nearby schools including Ps 244 Richard R Green, I.S. 285 Meyer Levin, and Ivy Hill Preparatory Charter School.
Ownership History
Date
Name
Owned For
Owner Type
Purchase Details
Closed on
Aug 11, 1995
Sold by
Baird Canute E
Bought by
Baird Canute E and Baird Kathleen
Current Estimated Value
Purchase Details
Closed on
Jun 14, 1994
Sold by
Baird Canute E
Bought by
Baird Canute E and Baird Kathleen
Home Financials for this Owner
Home Financials are based on the most recent Mortgage that was taken out on this home.
Original Mortgage
$106,000
Interest Rate
8.19%
Create a Home Valuation Report for This Property
The Home Valuation Report is an in-depth analysis detailing your home's value as well as a comparison with similar homes in the area
Home Values in the Area
Average Home Value in this Area
Purchase History
| Date | Buyer | Sale Price | Title Company |
|---|---|---|---|
| Baird Canute E | -- | -- | |
| Baird Canute E | -- | -- | |
| Baird Canute E | -- | American Title Insurance Co | |
| Baird Canute E | -- | American Title Insurance Co |
Source: Public Records
Mortgage History
| Date | Status | Borrower | Loan Amount |
|---|---|---|---|
| Closed | Baird Canute E | $106,000 |
Source: Public Records
Tax History
| Year | Tax Paid | Tax Assessment Tax Assessment Total Assessment is a certain percentage of the fair market value that is determined by local assessors to be the total taxable value of land and additions on the property. | Land | Improvement |
|---|---|---|---|---|
| 2025 | $5,422 | $37,500 | $11,280 | $26,220 |
| 2024 | $5,422 | $44,100 | $11,280 | $32,820 |
| 2023 | $5,156 | $49,800 | $11,280 | $38,520 |
| 2022 | $4,758 | $42,420 | $11,280 | $31,140 |
| 2021 | $5,023 | $42,600 | $11,280 | $31,320 |
| 2019 | $4,657 | $33,180 | $11,280 | $21,900 |
| 2018 | $4,253 | $22,323 | $9,782 | $12,541 |
| 2017 | $3,993 | $21,060 | $11,280 | $9,780 |
| 2016 | $4,138 | $22,247 | $10,251 | $11,996 |
| 2015 | $2,592 | $20,988 | $11,077 | $9,911 |
| 2014 | $2,592 | $19,800 | $12,540 | $7,260 |
Source: Public Records
Map
Nearby Homes
Your Personal Tour Guide
Ask me questions while you tour the home.