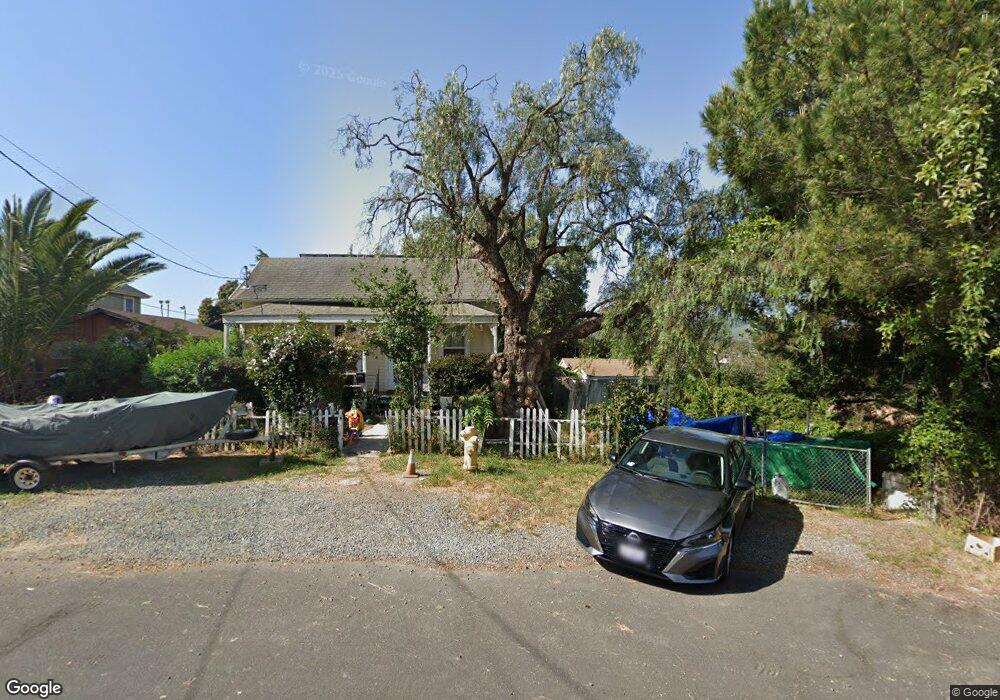
260 E I St Benicia, CA 94510
Estimated Value: $573,000 - $708,000
3
Beds
1
Bath
937
Sq Ft
$683/Sq Ft
Est. Value
About This Home
This home is located at 260 E I St, Benicia, CA 94510 and is currently estimated at $639,687, approximately $682 per square foot. 260 E I St is a home located in Solano County with nearby schools including Mary Farmar Elementary School, Benicia Middle School, and Benicia High School.
Ownership History
Date
Name
Owned For
Owner Type
Purchase Details
Closed on
Mar 28, 2006
Sold by
Tate Pamella A Redbird
Bought by
Tate Pamella A Redbird and The Redbird Tate Family Trust
Current Estimated Value
Purchase Details
Closed on
Apr 5, 1999
Sold by
Jones Jeffrey B and Jones Barbara
Bought by
Tate Pamella A Redbird
Home Financials for this Owner
Home Financials are based on the most recent Mortgage that was taken out on this home.
Original Mortgage
$130,000
Outstanding Balance
$31,219
Interest Rate
6.91%
Estimated Equity
$608,468
Purchase Details
Closed on
Mar 20, 1995
Sold by
Ruano Benir D and Ruano Kamie D
Bought by
Jones Jeffrey B and Jones Barbara
Home Financials for this Owner
Home Financials are based on the most recent Mortgage that was taken out on this home.
Original Mortgage
$135,850
Interest Rate
8.9%
Create a Home Valuation Report for This Property
The Home Valuation Report is an in-depth analysis detailing your home's value as well as a comparison with similar homes in the area
Home Values in the Area
Average Home Value in this Area
Purchase History
| Date | Buyer | Sale Price | Title Company |
|---|---|---|---|
| Tate Pamella A Redbird | -- | None Available | |
| Tate Pamella A Redbird | $210,000 | Fidelity National Title Co | |
| Jones Jeffrey B | $143,000 | North American Title |
Source: Public Records
Mortgage History
| Date | Status | Borrower | Loan Amount |
|---|---|---|---|
| Open | Tate Pamella A Redbird | $130,000 | |
| Previous Owner | Jones Jeffrey B | $135,850 |
Source: Public Records
Tax History
| Year | Tax Paid | Tax Assessment Tax Assessment Total Assessment is a certain percentage of the fair market value that is determined by local assessors to be the total taxable value of land and additions on the property. | Land | Improvement |
|---|---|---|---|---|
| 2025 | $3,781 | $329,211 | $94,059 | $235,152 |
| 2024 | $3,781 | $322,757 | $92,215 | $230,542 |
| 2023 | $3,689 | $316,429 | $90,407 | $226,022 |
| 2022 | $3,619 | $310,226 | $88,635 | $221,591 |
| 2021 | $3,544 | $304,145 | $86,898 | $217,247 |
| 2020 | $3,496 | $301,027 | $86,007 | $215,020 |
| 2019 | $3,434 | $295,125 | $84,321 | $210,804 |
| 2018 | $3,344 | $289,339 | $82,668 | $206,671 |
| 2017 | $3,266 | $283,667 | $81,048 | $202,619 |
| 2016 | $3,287 | $278,106 | $79,459 | $198,647 |
| 2015 | $3,202 | $273,930 | $78,266 | $195,664 |
| 2014 | $3,163 | $268,565 | $76,733 | $191,832 |
Source: Public Records
Map
Nearby Homes
Your Personal Tour Guide
Ask me questions while you tour the home.