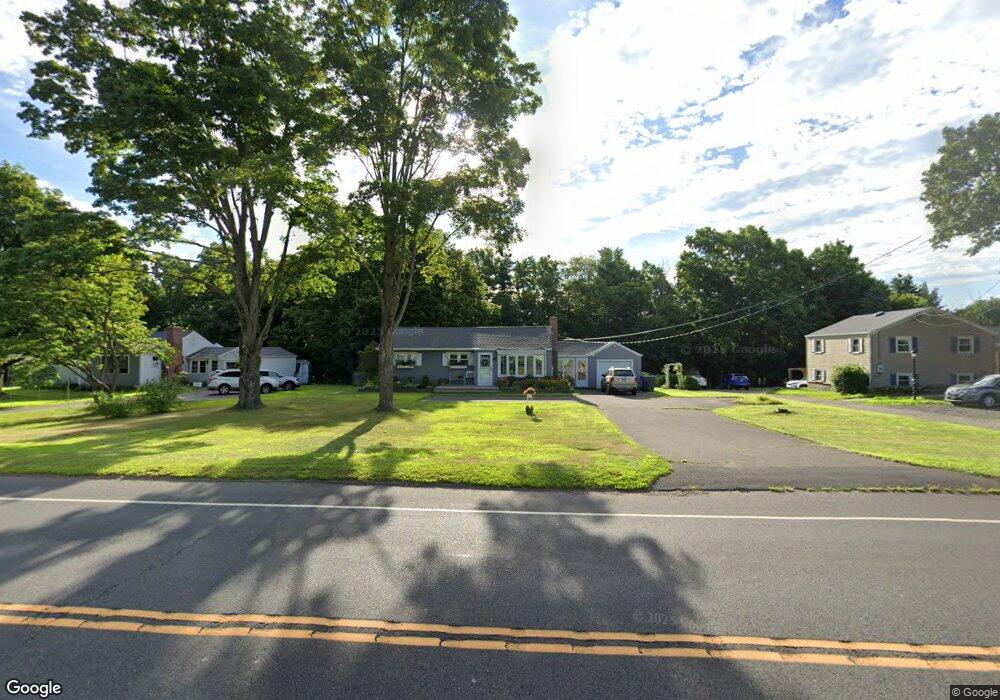
260 East St N Suffield, CT 06078
Estimated Value: $310,000 - $371,000
3
Beds
1
Bath
994
Sq Ft
$339/Sq Ft
Est. Value
About This Home
This home is located at 260 East St N, Suffield, CT 06078 and is currently estimated at $337,115, approximately $339 per square foot. 260 East St N is a home located in Hartford County with nearby schools including A. Ward Spaulding School, Mcalister Intermediate School, and Suffield Middle School.
Ownership History
Date
Name
Owned For
Owner Type
Purchase Details
Closed on
Aug 3, 1998
Sold by
Firestine Deborah
Bought by
Perry Stephen
Current Estimated Value
Home Financials for this Owner
Home Financials are based on the most recent Mortgage that was taken out on this home.
Original Mortgage
$120,054
Outstanding Balance
$21,769
Interest Rate
6.92%
Mortgage Type
Unknown
Estimated Equity
$315,346
Purchase Details
Closed on
Jul 28, 1997
Sold by
Massaro William and Massaro Anna
Bought by
Firestine Deborah
Create a Home Valuation Report for This Property
The Home Valuation Report is an in-depth analysis detailing your home's value as well as a comparison with similar homes in the area
Home Values in the Area
Average Home Value in this Area
Purchase History
| Date | Buyer | Sale Price | Title Company |
|---|---|---|---|
| Perry Stephen | $117,700 | -- | |
| Firestine Deborah | $118,000 | -- |
Source: Public Records
Mortgage History
| Date | Status | Borrower | Loan Amount |
|---|---|---|---|
| Open | Firestine Deborah | $30,000 | |
| Open | Firestine Deborah | $120,054 |
Source: Public Records
Tax History
| Year | Tax Paid | Tax Assessment Tax Assessment Total Assessment is a certain percentage of the fair market value that is determined by local assessors to be the total taxable value of land and additions on the property. | Land | Improvement |
|---|---|---|---|---|
| 2025 | $4,039 | $172,550 | $55,440 | $117,110 |
| 2024 | $3,905 | $172,550 | $55,440 | $117,110 |
| 2023 | $3,785 | $132,300 | $55,720 | $76,580 |
| 2022 | $3,785 | $132,300 | $55,720 | $76,580 |
| 2021 | $3,789 | $132,300 | $55,720 | $76,580 |
| 2020 | $3,789 | $132,300 | $55,720 | $76,580 |
| 2019 | $3,800 | $132,300 | $55,720 | $76,580 |
| 2018 | $3,707 | $126,420 | $53,900 | $72,520 |
| 2017 | $3,652 | $126,420 | $53,900 | $72,520 |
| 2016 | $3,565 | $126,420 | $53,900 | $72,520 |
| 2015 | $3,512 | $126,420 | $53,900 | $72,520 |
| 2014 | $3,429 | $126,420 | $53,900 | $72,520 |
Source: Public Records
Map
Nearby Homes
- 155 Mountain Laurel Way
- 4 Pebblestone Cir
- 24 Pebblestone Cir Unit 24
- 78 Landing Cir Unit 78
- 83 Landing Cir Unit 83
- 713 Thrall Ave
- 779 Bridge St
- 120 2nd St
- 98 1st St
- 80 S River St
- 3 Riverdale Rd
- 69 Prospect St
- 2 Pearl Street Extension
- 45 Douglas St
- 1165 Enfield St Unit 11
- 20 Walnut St
- 315 East St S
- 424 Bridge St
- 57 Asnuntuck St
- 1.5 Bridge Ln
- 250 East St N
- 268 East St N
- 240 East St N
- 278 East St N
- 259 East St N
- 230 East St N
- 269 East St N
- 288 East St N
- 279 East St N
- 220 East St N
- 289 East St N
- 991 Overhill Dr
- 40 Riverview Terrace
- 981 Overhill Dr
- 32 Riverview Terrace
- 46 Riverview Terrace
- 20 Riverview Terrace
- 300 East St N
- 971 Riverview Terrace
- 994 Overhill Dr
Your Personal Tour Guide
Ask me questions while you tour the home.