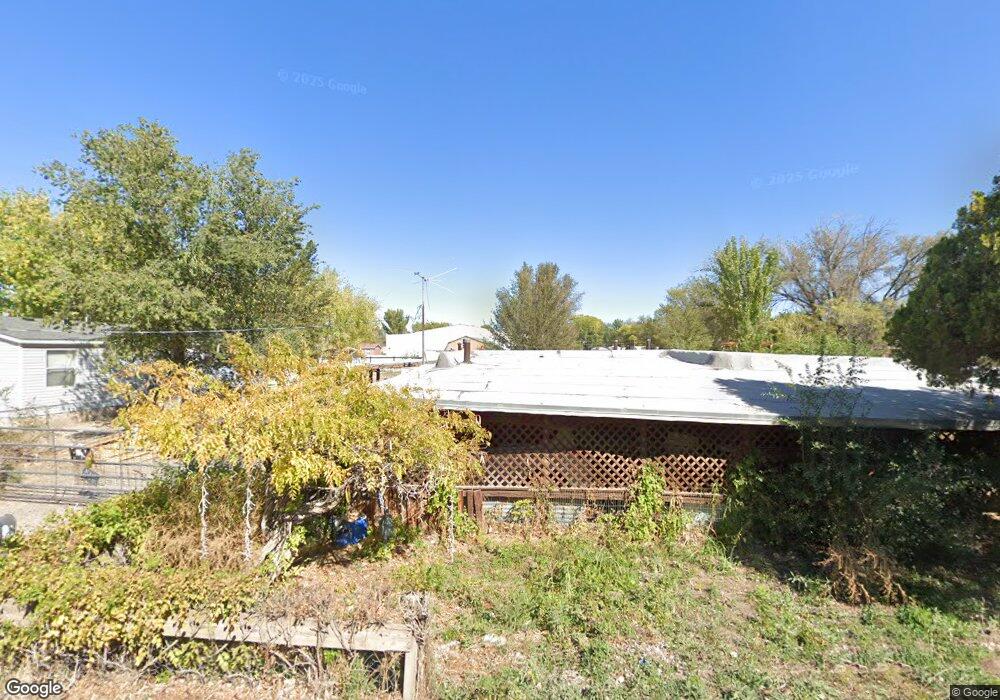
260 Lopez Rd SE Los Lunas, NM 87031
Estimated Value: $132,383 - $249,000
--
Bed
--
Bath
1,506
Sq Ft
$127/Sq Ft
Est. Value
About This Home
This home is located at 260 Lopez Rd SE, Los Lunas, NM 87031 and is currently estimated at $191,596, approximately $127 per square foot. 260 Lopez Rd SE is a home located in Valencia County with nearby schools including Los Lunas Elementary School, Los Lunas Middle School, and Los Lunas High School.
Create a Home Valuation Report for This Property
The Home Valuation Report is an in-depth analysis detailing your home's value as well as a comparison with similar homes in the area
Home Values in the Area
Average Home Value in this Area
Tax History Compared to Growth
Tax History
| Year | Tax Paid | Tax Assessment Tax Assessment Total Assessment is a certain percentage of the fair market value that is determined by local assessors to be the total taxable value of land and additions on the property. | Land | Improvement |
|---|---|---|---|---|
| 2024 | -- | $10,394 | $4,252 | $6,142 |
| 2023 | $0 | $10,092 | $4,188 | $5,904 |
| 2022 | $0 | $9,798 | $4,109 | $5,689 |
| 2021 | $0 | $9,513 | $9,513 | $0 |
| 2020 | $0 | $9,236 | $3,958 | $5,278 |
| 2019 | $48 | $8,967 | $3,958 | $5,009 |
| 2018 | $0 | $8,967 | $3,958 | $5,009 |
| 2017 | $0 | $8,967 | $3,958 | $5,009 |
| 2016 | -- | $8,967 | $3,958 | $5,009 |
| 2015 | -- | $8,879 | $3,958 | $4,921 |
| 2013 | -- | $8,370 | $3,958 | $4,412 |
| 2011 | -- | $24,765 | $11,529 | $13,236 |
Source: Public Records
Map
Nearby Homes
- 259 Lopez Rd SE
- 1604 Juan Perea Rd
- 1015 Manzano Ave SE
- 1152 Los Nardos
- 1235 Highway 314 SW
- 3892 Hernandez St SW
- 1118 Las Rosas Dr SE
- 1030 Aspen Ct
- 668 Helen Cir
- 0 Carson Dr
- 441 Colonial Ave SW
- 461 Los Lentes Rd SE
- 1160 Pine Ct SE
- 344 Los Lentes Rd SE
- 325 Verde Dr SW
- 600 Don Federico Ct SW
- 414 Adeline Ave SW
- 435 Adeline Ave SW
- 0 Rio Del Oro: Lot: 40 Unit 12 1073698
- 156 Edeal Rd
- 267 Lopez Rd SE
- 244 Lopez Rd SE
- 269 Lopez Rd SE
- 212 Lopez Rd SE
- 338 Lopez Rd SE
- 301 Lopez Rd SE
- 328 Lopez Rd SE
- 204 Lopez Rd SE
- 268 Gonzales Ln SE
- 1300 Juan Perea Rd
- 203 Lopez Rd SE
- 351 Lopez Rd SE
- 305 Lucero Ln
- 278 Gonzales Ln SE
- 1326 Juan Perea Rd Unit A
- 0 Lopez Rd SE
- 1305 Lucero Ln
- 1326A Juan Perea Rd
- 1419 Los Lentes Rd SE
- 352 Lopez Rd SE