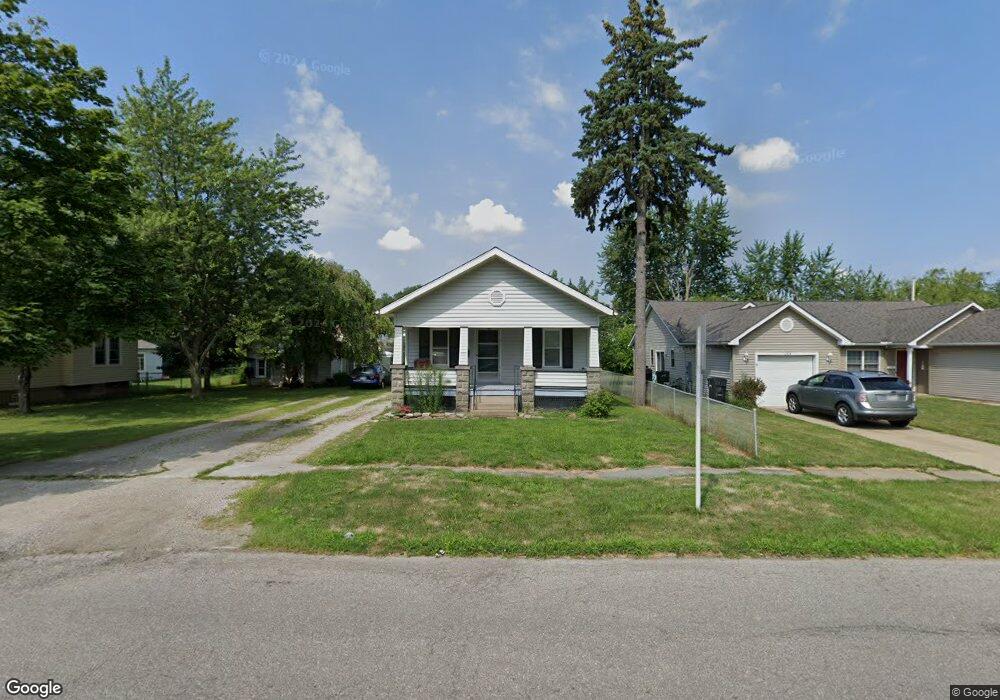
260 Olive St Elyria, OH 44035
Estimated Value: $114,000 - $155,000
2
Beds
2
Baths
890
Sq Ft
$147/Sq Ft
Est. Value
About This Home
This home is located at 260 Olive St, Elyria, OH 44035 and is currently estimated at $130,583, approximately $146 per square foot. 260 Olive St is a home located in Lorain County with nearby schools including Ely Elementary School, Northwood Middle School, and Elyria High School.
Ownership History
Date
Name
Owned For
Owner Type
Purchase Details
Closed on
Jan 23, 2024
Sold by
Provoznik Susan E
Bought by
Provoznik Susan E
Current Estimated Value
Purchase Details
Closed on
Sep 30, 2010
Sold by
Federal Home Loan Mortgage Corporation
Bought by
Provoznik Susan
Purchase Details
Closed on
Apr 22, 2010
Sold by
Jones Teresa L
Bought by
Federal Home Loan Mortgage Corporation
Purchase Details
Closed on
May 14, 1997
Sold by
Szalay Cynthia
Bought by
Jones Thomas L and Jones Teresa L
Home Financials for this Owner
Home Financials are based on the most recent Mortgage that was taken out on this home.
Original Mortgage
$73,950
Interest Rate
8.27%
Mortgage Type
New Conventional
Create a Home Valuation Report for This Property
The Home Valuation Report is an in-depth analysis detailing your home's value as well as a comparison with similar homes in the area
Home Values in the Area
Average Home Value in this Area
Purchase History
| Date | Buyer | Sale Price | Title Company |
|---|---|---|---|
| Provoznik Susan E | -- | None Listed On Document | |
| Provoznik Susan | $27,100 | Attorney | |
| Federal Home Loan Mortgage Corporation | $46,000 | None Available | |
| Jones Thomas L | $83,250 | -- |
Source: Public Records
Mortgage History
| Date | Status | Borrower | Loan Amount |
|---|---|---|---|
| Previous Owner | Jones Thomas L | $73,950 |
Source: Public Records
Tax History
| Year | Tax Paid | Tax Assessment Tax Assessment Total Assessment is a certain percentage of the fair market value that is determined by local assessors to be the total taxable value of land and additions on the property. | Land | Improvement |
|---|---|---|---|---|
| 2024 | $1,742 | $35,942 | $9,688 | $26,254 |
| 2023 | $1,356 | $24,283 | $6,892 | $17,392 |
| 2022 | $1,351 | $24,283 | $6,892 | $17,392 |
| 2021 | $1,354 | $24,283 | $6,892 | $17,392 |
| 2020 | $1,246 | $19,870 | $5,640 | $14,230 |
| 2019 | $1,238 | $19,870 | $5,640 | $14,230 |
| 2018 | $1,241 | $19,870 | $5,640 | $14,230 |
| 2017 | $1,283 | $19,690 | $5,680 | $14,010 |
| 2016 | $1,266 | $19,690 | $5,680 | $14,010 |
| 2015 | $1,188 | $19,690 | $5,680 | $14,010 |
| 2014 | $1,165 | $20,060 | $5,790 | $14,270 |
| 2013 | $1,154 | $20,060 | $5,790 | $14,270 |
Source: Public Records
Map
Nearby Homes
- 147 Bellfield Ave
- 120 Longford Ave
- 144 Roosevelt Ave
- 249 Roosevelt Ave
- 127 Beebe Ave
- 235 Brandtson Ave
- 123 Harwood St
- 164 Woodbury St
- 147 Hamilton St
- 137 Lafayette St
- 463 Poplar St
- 141 Elma Dr
- 513 Gulf Rd
- 297 Abbe Rd N
- 171 S Logan St
- 315 West Glen
- 805 Clark St
- 347 Ohio St
- 209 Clark St
- 118 Brandemere Ct
Your Personal Tour Guide
Ask me questions while you tour the home.