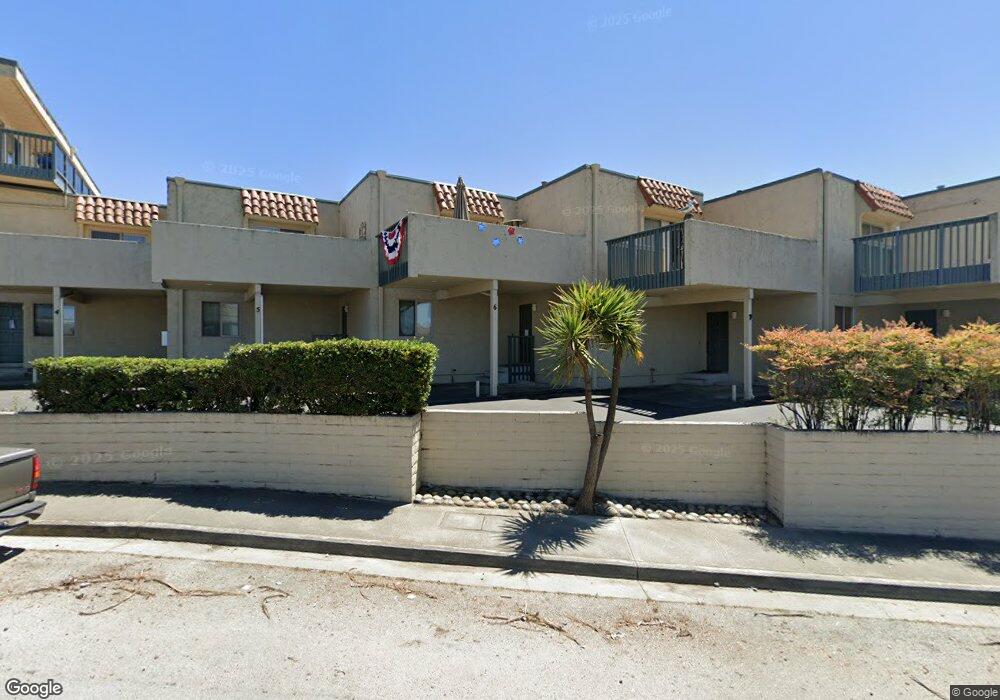
260 Rio Del Mar Blvd Unit 18 Aptos, CA 95003
Rio del Mar NeighborhoodEstimated Value: $732,718 - $1,107,000
1
Bed
1
Bath
716
Sq Ft
$1,348/Sq Ft
Est. Value
About This Home
This home is located at 260 Rio Del Mar Blvd Unit 18, Aptos, CA 95003 and is currently estimated at $964,930, approximately $1,347 per square foot. 260 Rio Del Mar Blvd Unit 18 is a home located in Santa Cruz County with nearby schools including Rio Del Mar Elementary School, Aptos Junior High School, and Aptos High School.
Ownership History
Date
Name
Owned For
Owner Type
Purchase Details
Closed on
Nov 15, 2023
Sold by
Rinnert Denise Marie
Bought by
Denise Marie Rinnert Separate Property Trust and Rinnert
Current Estimated Value
Purchase Details
Closed on
Dec 17, 2020
Sold by
Rinnert Denise and Estate Of Roger L Neathery
Bought by
Rinnert Denise
Purchase Details
Closed on
Jul 24, 2012
Sold by
Mann Joseph Frank and Parisius Kim
Bought by
Neathery Roger L
Home Financials for this Owner
Home Financials are based on the most recent Mortgage that was taken out on this home.
Original Mortgage
$130,600
Interest Rate
3.62%
Mortgage Type
New Conventional
Purchase Details
Closed on
Mar 16, 2004
Sold by
Holzman Mickey E H and The Mickey E H Holzman Trust
Bought by
Mann Joseph Frank and Parisius Kim
Purchase Details
Closed on
Sep 24, 2002
Sold by
Daw Mary Lou
Bought by
Daw Mary Lou and The Mary Lou Daw Family Trust
Create a Home Valuation Report for This Property
The Home Valuation Report is an in-depth analysis detailing your home's value as well as a comparison with similar homes in the area
Home Values in the Area
Average Home Value in this Area
Purchase History
| Date | Buyer | Sale Price | Title Company |
|---|---|---|---|
| Denise Marie Rinnert Separate Property Trust | -- | None Listed On Document | |
| Rinnert Denise | -- | None Available | |
| Neathery Roger L | $499,000 | Chicago Title Company | |
| Mann Joseph Frank | $450,000 | First American Title Co | |
| Daw Mary Lou | -- | -- |
Source: Public Records
Mortgage History
| Date | Status | Borrower | Loan Amount |
|---|---|---|---|
| Previous Owner | Neathery Roger L | $130,600 |
Source: Public Records
Tax History Compared to Growth
Tax History
| Year | Tax Paid | Tax Assessment Tax Assessment Total Assessment is a certain percentage of the fair market value that is determined by local assessors to be the total taxable value of land and additions on the property. | Land | Improvement |
|---|---|---|---|---|
| 2025 | $6,728 | $517,200 | $258,600 | $258,600 |
| 2023 | $6,572 | $497,116 | $248,558 | $248,558 |
| 2022 | $6,416 | $487,370 | $243,685 | $243,685 |
| 2021 | $6,174 | $477,814 | $238,907 | $238,907 |
| 2020 | $6,065 | $472,914 | $236,457 | $236,457 |
| 2019 | $5,958 | $463,640 | $231,820 | $231,820 |
| 2018 | $5,793 | $454,550 | $227,275 | $227,275 |
| 2017 | $5,735 | $445,636 | $222,818 | $222,818 |
| 2016 | $5,577 | $436,898 | $218,449 | $218,449 |
| 2015 | $5,502 | $430,336 | $215,168 | $215,168 |
| 2014 | $5,371 | $421,906 | $210,953 | $210,953 |
Source: Public Records
Map
Nearby Homes
- 230 Rio Del Mar Blvd Unit K
- 325 Beach Dr
- 534 Beach Dr
- 140 Marina Ave Unit A
- 325 Kingsbury Dr
- 130 Hainline Rd
- 320 Cliff Dr
- 118 Marina Ave
- 204 Aptos Beach Dr
- 124 Winfield Way
- 346 Kingsbury Dr
- 307 Treasure Island Dr Unit 1
- 335 Treasure Island Dr
- 218 Moosehead Dr
- 216 Martin Dr
- 220 Shoreview Dr
- 221 Moosehead Dr
- 422 Seaview Dr
- 433 Seaview Dr
- 129 Santa Cruz Ave
- 260 Rio Del Mar Blvd Unit 34
- 260 Rio Del Mar Blvd Unit 15
- 260 Rio Del Mar Blvd Unit 16
- 260 Rio Del Mar Blvd Unit 17
- 260 Rio Del Mar Blvd Unit 19
- 260 Rio Del Mar Blvd Unit 20
- 260 Rio Del Mar Blvd Unit 21
- 260 Rio Del Mar Blvd Unit 22
- 260 Rio Del Mar Blvd Unit 23
- 260 Rio Del Mar Blvd Unit 3
- 260 Rio Del Mar Blvd Unit 6
- 260 Rio Del Mar Blvd Unit 7
- 260 Rio Del Mar Blvd Unit 9
- 260 Rio Del Mar Blvd Unit 10
- 260 Rio Del Mar Blvd Unit 11
- 260 Rio Del Mar Blvd Unit 12
- 260 Rio Del Mar Blvd Unit 24
- 260 Rio Del Mar Blvd Unit 25
- 260 Rio Del Mar Blvd Unit 26
- 260 Rio Del Mar Blvd Unit 27