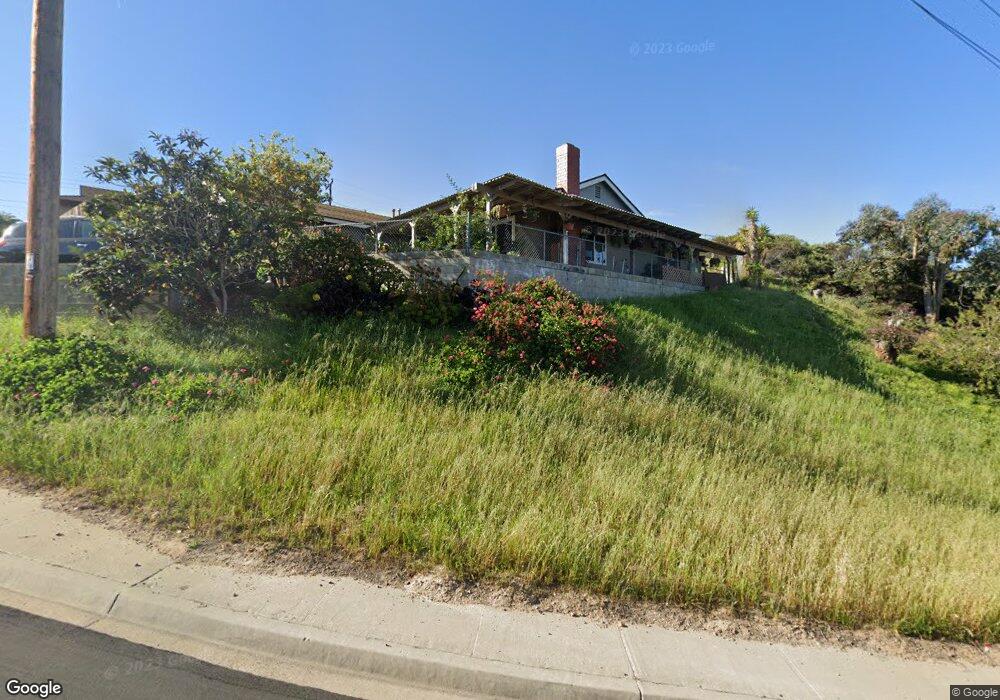
260 Sunswept St San Diego, CA 92114
Bay Terraces NeighborhoodEstimated Value: $779,000 - $936,000
4
Beds
3
Baths
1,386
Sq Ft
$598/Sq Ft
Est. Value
About This Home
This home is located at 260 Sunswept St, San Diego, CA 92114 and is currently estimated at $828,378, approximately $597 per square foot. 260 Sunswept St is a home located in San Diego County with nearby schools including Boone Elementary School, Bell Middle School, and Morse High School.
Ownership History
Date
Name
Owned For
Owner Type
Purchase Details
Closed on
Mar 26, 2021
Sold by
Wiseman Wilma P and Wiseman Cam W
Bought by
Wiseman Wilma P and Wiseman Cam W
Current Estimated Value
Home Financials for this Owner
Home Financials are based on the most recent Mortgage that was taken out on this home.
Original Mortgage
$219,000
Outstanding Balance
$197,411
Interest Rate
2.9%
Mortgage Type
New Conventional
Estimated Equity
$630,967
Purchase Details
Closed on
Aug 22, 2008
Sold by
Wiseman Wilma P
Bought by
Wiseman Wilma P and Wiseman Cam W
Home Financials for this Owner
Home Financials are based on the most recent Mortgage that was taken out on this home.
Original Mortgage
$258,000
Interest Rate
6.49%
Mortgage Type
Stand Alone Refi Refinance Of Original Loan
Purchase Details
Closed on
Jul 9, 1993
Bought by
Wiseman Patrick W Wilma P
Purchase Details
Closed on
Jan 15, 1986
Create a Home Valuation Report for This Property
The Home Valuation Report is an in-depth analysis detailing your home's value as well as a comparison with similar homes in the area
Home Values in the Area
Average Home Value in this Area
Purchase History
| Date | Buyer | Sale Price | Title Company |
|---|---|---|---|
| Wiseman Wilma P | -- | Title365 | |
| Wiseman Cam W | -- | Title365 | |
| Wiseman Wilma P | -- | Ticor Title Company | |
| Wiseman Wilma P | -- | Ticor Title Company | |
| Wiseman Patrick W Wilma P | $146,500 | -- | |
| -- | $89,000 | -- |
Source: Public Records
Mortgage History
| Date | Status | Borrower | Loan Amount |
|---|---|---|---|
| Open | Wiseman Wilma P | $219,000 | |
| Closed | Wiseman Wilma P | $258,000 |
Source: Public Records
Tax History Compared to Growth
Tax History
| Year | Tax Paid | Tax Assessment Tax Assessment Total Assessment is a certain percentage of the fair market value that is determined by local assessors to be the total taxable value of land and additions on the property. | Land | Improvement |
|---|---|---|---|---|
| 2025 | $3,732 | $314,220 | $106,288 | $207,932 |
| 2024 | $3,732 | $308,059 | $104,204 | $203,855 |
| 2023 | $3,648 | $302,019 | $102,161 | $199,858 |
| 2022 | $3,549 | $296,098 | $100,158 | $195,940 |
| 2021 | $3,524 | $290,294 | $98,195 | $192,099 |
| 2020 | $3,480 | $287,319 | $97,189 | $190,130 |
| 2019 | $3,417 | $281,686 | $95,284 | $186,402 |
| 2018 | $3,194 | $276,164 | $93,416 | $182,748 |
| 2017 | $81 | $270,750 | $91,585 | $179,165 |
| 2016 | $3,064 | $265,442 | $89,790 | $175,652 |
| 2015 | $3,018 | $261,456 | $88,442 | $173,014 |
| 2014 | $2,970 | $256,335 | $86,710 | $169,625 |
Source: Public Records
Map
Nearby Homes
- 240 Ledgewood Ln
- 7449 Bullock Dr
- 124 Palawan Way
- 7263 Aquamarine Rd
- 7281 Danawoods Ct
- 177 Coralwood Dr
- 763 Kingswood St
- 7358 Gribble St
- 7853 Gribble St
- 111 69th St
- 348 Sychar Rd
- 7549 Goode St
- 7969 Royal Oak Place
- 1153 Manzana Way
- 8017 Gribble St
- 256 S Royal Oak Dr
- 366 Lausanne Dr
- 2482 Manzana Way
- 7085 Madrone Ave
- 425 S Meadowbrook Dr Unit 124
- 310 Northgate St
- 316 Northgate St
- 302 Northgate St
- 324 Northgate St
- 267 Sunswept St
- 243 Sunswept St
- 249 Sunswept St
- 273 Sunswept St
- 255 Sunswept St
- 237 Sunswept St
- 261 Sunswept St
- 279 Sunswept St
- 240 Sunswept St
- 332 Northgate St
- 309 Northgate St
- 317 Northgate St
- 231 Sunswept St
- 285 Sunswept St
- 301 Northgate St
- 7215 Bullock Dr