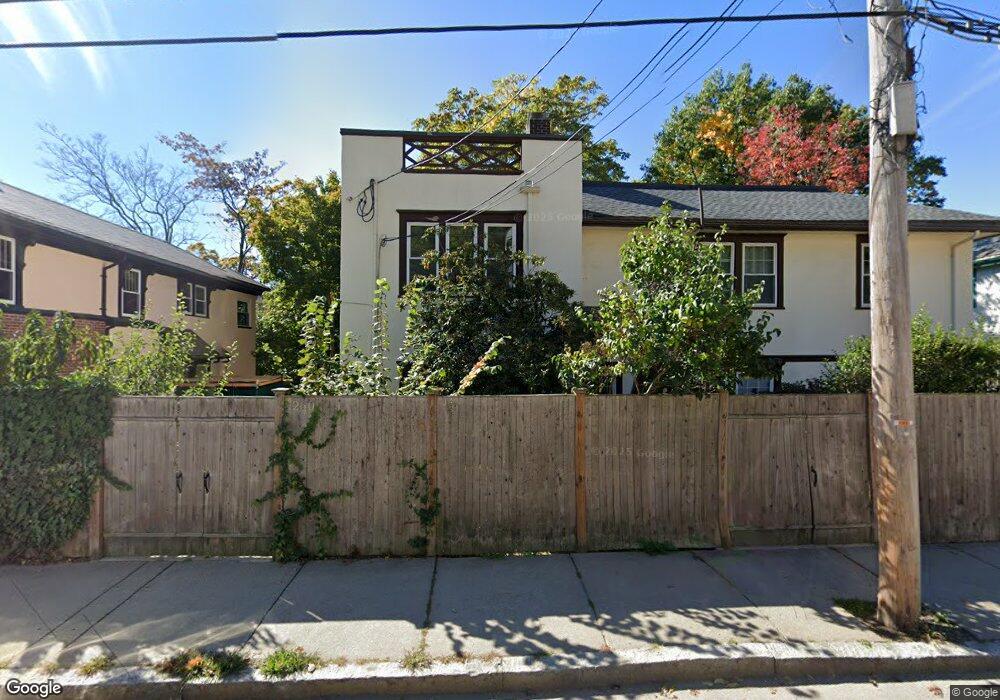
260 Tappan St Unit 2 Brookline, MA 02445
Washington Square NeighborhoodEstimated Value: $1,045,000 - $1,408,000
3
Beds
2
Baths
1,751
Sq Ft
$717/Sq Ft
Est. Value
About This Home
This home is located at 260 Tappan St Unit 2, Brookline, MA 02445 and is currently estimated at $1,255,053, approximately $716 per square foot. 260 Tappan St Unit 2 is a home located in Norfolk County with nearby schools including John D. Runkle School, Maimonides School, and Torah Academy.
Ownership History
Date
Name
Owned For
Owner Type
Purchase Details
Closed on
Apr 18, 2023
Sold by
Landesman Esther and Landesman Yosef
Bought by
260 Tappan St Unit 2 Nt
Current Estimated Value
Purchase Details
Closed on
May 13, 2019
Sold by
Landesman Yosef and Landesman Esther
Bought by
Landesman Esther and Landesman Yosef
Purchase Details
Closed on
Aug 19, 2004
Sold by
Lapierre Katherine A
Bought by
Landesman Ester and Landesman Yosef
Home Financials for this Owner
Home Financials are based on the most recent Mortgage that was taken out on this home.
Original Mortgage
$290,000
Interest Rate
6.03%
Mortgage Type
Purchase Money Mortgage
Purchase Details
Closed on
Apr 8, 1992
Sold by
Metz Alan
Bought by
Lapierre Katherine A
Home Financials for this Owner
Home Financials are based on the most recent Mortgage that was taken out on this home.
Original Mortgage
$168,000
Interest Rate
8.73%
Mortgage Type
Purchase Money Mortgage
Create a Home Valuation Report for This Property
The Home Valuation Report is an in-depth analysis detailing your home's value as well as a comparison with similar homes in the area
Home Values in the Area
Average Home Value in this Area
Purchase History
| Date | Buyer | Sale Price | Title Company |
|---|---|---|---|
| 260 Tappan St Unit 2 Nt | -- | None Available | |
| Landesman Esther | -- | -- | |
| Landesman Ester | $545,000 | -- | |
| Lapierre Katherine A | $210,000 | -- | |
| Lapierre Katherine A | $210,000 | -- |
Source: Public Records
Mortgage History
| Date | Status | Borrower | Loan Amount |
|---|---|---|---|
| Previous Owner | Landesman Ester | $290,000 | |
| Previous Owner | Lapierre Katherine A | $168,000 |
Source: Public Records
Tax History Compared to Growth
Tax History
| Year | Tax Paid | Tax Assessment Tax Assessment Total Assessment is a certain percentage of the fair market value that is determined by local assessors to be the total taxable value of land and additions on the property. | Land | Improvement |
|---|---|---|---|---|
| 2025 | $11,199 | $1,134,700 | $0 | $1,134,700 |
| 2024 | $10,869 | $1,112,500 | $0 | $1,112,500 |
| 2023 | $10,353 | $1,038,400 | $0 | $1,038,400 |
| 2022 | $10,274 | $1,008,200 | $0 | $1,008,200 |
| 2021 | $9,783 | $998,300 | $0 | $998,300 |
| 2020 | $9,030 | $955,600 | $0 | $955,600 |
| 2019 | $8,528 | $910,100 | $0 | $910,100 |
| 2018 | $8,199 | $866,700 | $0 | $866,700 |
| 2017 | $8,063 | $816,100 | $0 | $816,100 |
| 2016 | $7,731 | $741,900 | $0 | $741,900 |
| 2015 | $7,204 | $674,500 | $0 | $674,500 |
| 2014 | $7,198 | $632,000 | $0 | $632,000 |
Source: Public Records
Map
Nearby Homes
- 184 Rawson Rd
- 255 Tappan St
- 94 Beaconsfield Rd Unit 201
- 324 Tappan St Unit 1
- 324 Tappan St Unit 2
- 16 Garrison Rd Unit 7
- 90 Addington Rd Unit 1
- 333 Clark Rd
- 135 Beaconsfield Rd Unit 1
- 141 Beaconsfield Rd Unit 6
- 1731 Beacon St Unit 717
- 1731 Beacon St Unit 1502
- 108-116 Winthrop Rd
- 57 University Rd Unit 3
- 15 Colbourne Crescent Unit 2
- 12 Colbourne Crescent Unit 1
- 1763 Beacon St Unit A
- 84 Winthrop Rd Unit 1
- 84 Winthrop Rd
- 648 Washington St Unit 7
- 260 Tappan St Unit 1
- 260 Tappan St Unit 260-B
- 262 Tappan St Unit 3
- 254 Tappan St Unit 256
- 264 Tappan St Unit 1
- 264 Tappan St Unit 266
- 264 Tappan St Unit 264
- 37 Beaconsfield Rd Unit 39
- 37 Beaconsfield Rd Unit 2
- 37 Beaconsfield Rd Unit 4-bed
- 39 Beaconsfield Rd Unit 1
- 39 Beaconsfield Rd
- 37 Beaconsfield Rd
- 39 Beaconsfield Rd
- 37 Beaconsfield Rd Unit 1
- 39 Beaconsfield Rd Unit 39
- 35 Beaconsfield Rd Unit 1
- 252 Tappan St
- 33 Beaconsfield Rd
- 33 Beaconsfield Rd Unit 2