Estimated Value: $444,000 - $472,000
3
Beds
2
Baths
1,334
Sq Ft
$343/Sq Ft
Est. Value
About This Home
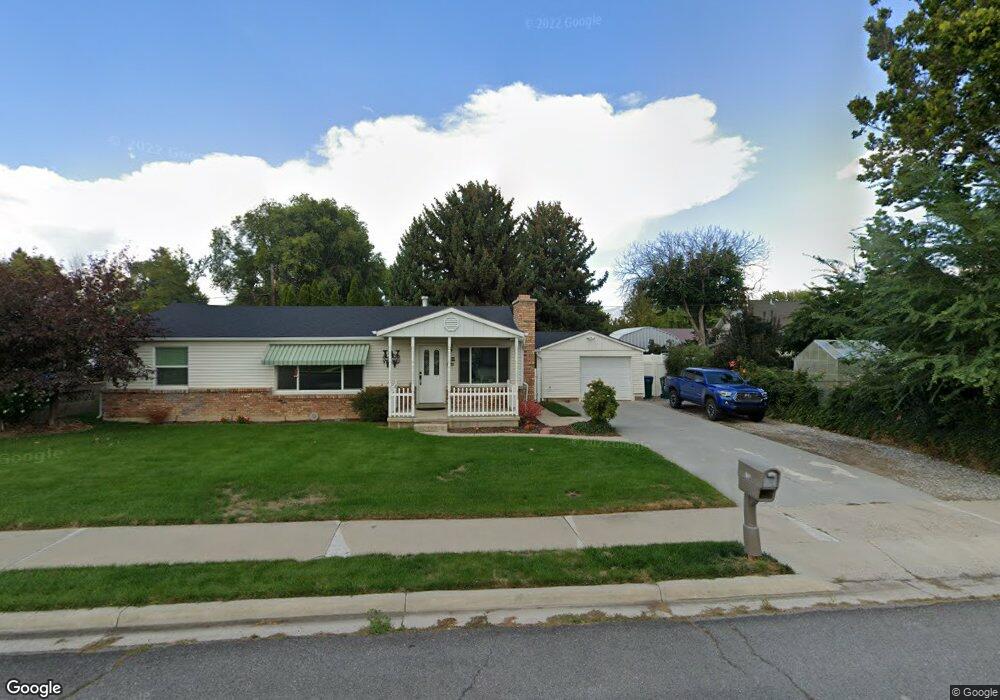
This home is located at 260 W 500 N, Lehi, UT 84043 and is currently estimated at $457,140, approximately $342 per square foot. 260 W 500 N is a home located in Utah County with nearby schools including Lehi Elementary School, Lehi Junior High School, and Lehi High School.
Ownership History
Date
Name
Owned For
Owner Type
Purchase Details
Closed on
Oct 6, 2016
Sold by
Buswell Caleb and Buswell Kira
Bought by
Daun Jeffrey Allen and Daun Ramona
Current Estimated Value
Home Financials for this Owner
Home Financials are based on the most recent Mortgage that was taken out on this home.
Original Mortgage
$168,000
Outstanding Balance
$134,555
Interest Rate
3.43%
Mortgage Type
New Conventional
Estimated Equity
$322,585
Purchase Details
Closed on
May 29, 2008
Sold by
Smith Michael G and Smith Jerry A
Bought by
Buswell Caleb and Buswell Kira
Purchase Details
Closed on
Feb 1, 2007
Sold by
Yerke Howard C
Bought by
Smith Michael G and Smith Jerry A
Create a Home Valuation Report for This Property
The Home Valuation Report is an in-depth analysis detailing your home's value as well as a comparison with similar homes in the area
Home Values in the Area
Average Home Value in this Area
Purchase History
| Date | Buyer | Sale Price | Title Company |
|---|---|---|---|
| Daun Jeffrey Allen | -- | Meridian Title Co | |
| Buswell Caleb | -- | Title West Highland Offic | |
| Smith Michael G | -- | Title West Title Company |
Source: Public Records
Mortgage History
| Date | Status | Borrower | Loan Amount |
|---|---|---|---|
| Open | Daun Jeffrey Allen | $168,000 |
Source: Public Records
Tax History Compared to Growth
Tax History
| Year | Tax Paid | Tax Assessment Tax Assessment Total Assessment is a certain percentage of the fair market value that is determined by local assessors to be the total taxable value of land and additions on the property. | Land | Improvement |
|---|---|---|---|---|
| 2025 | $1,778 | $222,640 | $221,800 | $183,000 |
| 2024 | $1,778 | $208,120 | $0 | $0 |
| 2023 | $1,655 | $210,320 | $0 | $0 |
| 2022 | $1,743 | $214,665 | $0 | $0 |
| 2021 | $1,530 | $284,900 | $109,400 | $175,500 |
| 2020 | $1,441 | $265,300 | $101,300 | $164,000 |
| 2019 | $1,275 | $243,900 | $101,300 | $142,600 |
| 2018 | $1,208 | $218,500 | $92,600 | $125,900 |
| 2017 | $1,061 | $102,025 | $0 | $0 |
| 2016 | -- | $91,135 | $0 | $0 |
| 2015 | $1,044 | $88,440 | $0 | $0 |
| 2014 | $1,011 | $85,140 | $0 | $0 |
Source: Public Records
Map
Nearby Homes
- 4561 N McKechnie Way Dr Unit 1119
- 143 W 300 N
- 443 W 820 N
- 281 N Center St
- 171 E 400 N
- 255 W 100 N
- 7 E State St
- 68 W State St
- 155 W State St Unit TRLR 3
- 996 N 200 W
- 485 W Main St
- 578 N Woods Dr
- 174 E 100 N
- 1150 N 200 W Unit 6
- 705 N 400 E
- 428 E 500 N
- 595 S 600 E
- 1329 N 100 E Unit 21
- 1295 N 190 E
- 285 S 660 W