


260 W Fork Rd Mount Pleasant, TN 38474
Estimated payment $3,480/month
About This Home
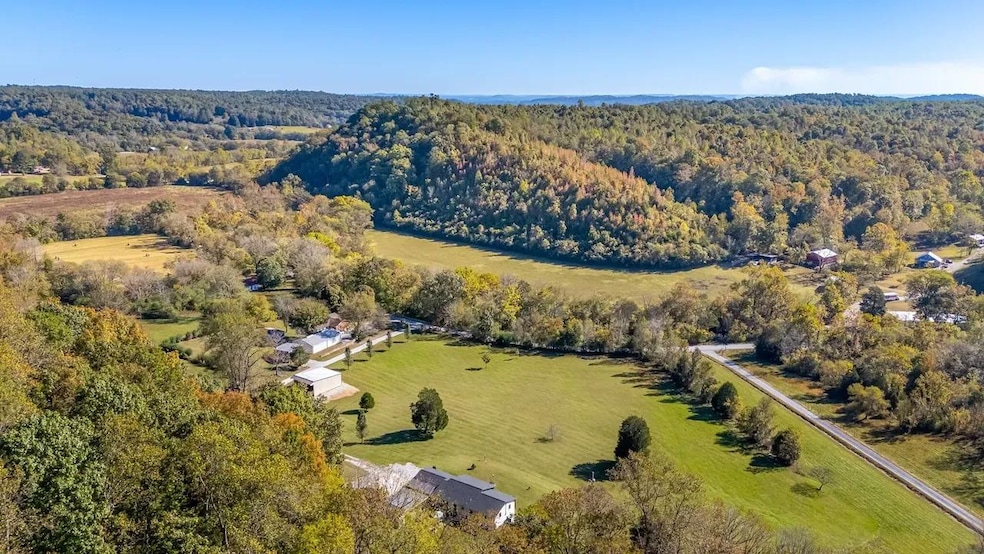
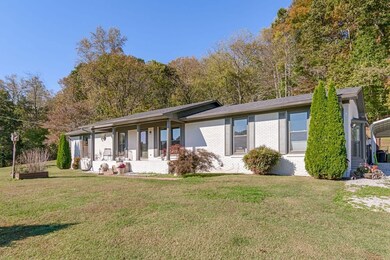
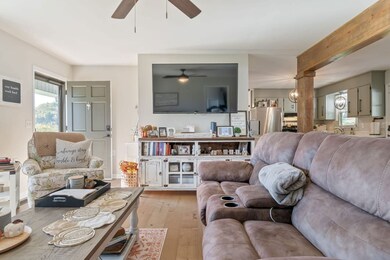
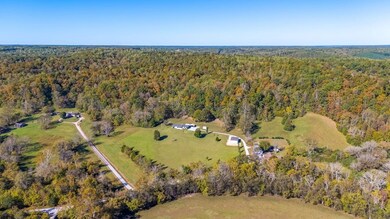
Tucked into sixteen acres of rolling Mount Pleasant countryside, 260 W Fork Road pairs the charm of an established home with the feel of something brand new. The brick residence still carries its original bones and character, but thoughtful renovations have opened the floor plan and brought new life to every space brighter rooms, clean lines, and a comfortable flow made for gathering. From the covered porch and deck to the fenced backyard and hot tub, the property invites you to slow down and enjoy the peace of its setting. Open pasture stretches out front while wooded trails add privacy in back, creating a balance of open views and quiet retreat that’s hard to find. Fresh, inviting, and full of Tennessee warmth this is country living done right.

Home Details
Home Type
- Single Family
Est. Annual Taxes
- $579
Bedrooms and Bathrooms
- 3 Bedrooms
- 2 Full Bathrooms
Map
Home Values in the Area
Average Home Value in this Area
Tax History
| Year | Tax Paid | Tax Assessment Tax Assessment Total Assessment is a certain percentage of the fair market value that is determined by local assessors to be the total taxable value of land and additions on the property. | Land | Improvement |
|---|---|---|---|---|
| 2025 | $579 | $72,975 | $0 | $0 |
| 2024 | $579 | $30,750 | $3,875 | $26,875 |
| 2023 | $579 | $30,750 | $3,875 | $26,875 |
| 2022 | $579 | $30,750 | $3,875 | $26,875 |
| 2021 | $579 | $30,750 | $3,875 | $26,875 |
| 2020 | $546 | $38,675 | $11,800 | $26,875 |
| 2019 | $582 | $25,350 | $3,575 | $21,775 |
| 2018 | $582 | $25,350 | $3,575 | $21,775 |
| 2017 | $582 | $25,350 | $3,575 | $21,775 |
| 2016 | $582 | $25,350 | $3,575 | $21,775 |
| 2015 | -- | $25,350 | $3,575 | $21,775 |
| 2014 | -- | $25,350 | $3,575 | $21,775 |
| 2013 | -- | $29,550 | $0 | $0 |
Property History
| Date | Event | Price | List to Sale | Price per Sq Ft | Prior Sale |
|---|---|---|---|---|---|
| 11/11/2025 11/11/25 | Price Changed | $649,999 | +0.2% | $375 / Sq Ft | |
| 11/10/2025 11/10/25 | Price Changed | $649,000 | -7.2% | $374 / Sq Ft | |
| 10/18/2025 10/18/25 | For Sale | $699,000 | +65.6% | $403 / Sq Ft | |
| 06/28/2024 06/28/24 | Sold | $422,000 | +2.9% | $258 / Sq Ft | View Prior Sale |
| 05/11/2024 05/11/24 | Pending | -- | -- | -- | |
| 05/10/2024 05/10/24 | Price Changed | $410,000 | -7.9% | $251 / Sq Ft | |
| 05/04/2024 05/04/24 | Price Changed | $445,000 | -6.1% | $272 / Sq Ft | |
| 04/29/2024 04/29/24 | Price Changed | $474,000 | -5.0% | $290 / Sq Ft | |
| 04/16/2024 04/16/24 | Price Changed | $499,000 | -5.0% | $305 / Sq Ft | |
| 04/13/2024 04/13/24 | Price Changed | $525,000 | -3.7% | $321 / Sq Ft | |
| 03/28/2024 03/28/24 | For Sale | $545,000 | -- | $334 / Sq Ft |
Purchase History
| Date | Type | Sale Price | Title Company |
|---|---|---|---|
| Warranty Deed | $422,000 | Lenders Title | |
| Warranty Deed | $422,000 | Lenders Title | |
| Interfamily Deed Transfer | -- | None Available | |
| Interfamily Deed Transfer | -- | None Available | |
| Quit Claim Deed | -- | -- | |
| Warranty Deed | $111,800 | -- | |
| Deed | -- | -- | |
| Deed | -- | -- | |
| Deed | -- | -- |
Mortgage History
| Date | Status | Loan Amount | Loan Type |
|---|---|---|---|
| Open | $414,356 | FHA | |
| Closed | $414,356 | FHA | |
| Previous Owner | $99,790 | New Conventional | |
| Previous Owner | $111,800 | Cash |
- 220 Ellies Run
- 0 Baptist Branch Rd
- 280 Baptist Branch Rd
- 8635 King Hollow Rd
- 202 Ravenridge Rd
- 202 Ravenridge Dr
- 121 High Forest Dr
- 2417 Esque Sharp Rd
- 0 Lawrenceburg Hwy Unit 20416726
- 1763 Highway 166 N
- 2244 Baptist Branch Rd
- 180 Webb Rd
- 0 Webb Rd
- 160 Webb Rd
- 0 Johnson Hill Rd Unit RTC3008980
- 0 Johnson Hill Rd Unit RTC2699326
- 121 Emerald Dr
- 4566 Hampshire Pike
- 2 Mount Joy Rd
- 3 Mount Joy Rd
- 406 N College St
- 3931 Taylors Store Rd Unit Lot 2
- 135 Clauson Dr
- 410 Watts Dr
- 209 Hampton Rd
- 5142 Pace Park Cir
- 5140 Pace Park Cir
- 1752 University Dr
- 1820 Emily Ln
- 712 Paige Ct
- 1908 Susan Rd
- 1820 Elizabeth Ln
- 1605 Mary Ct
- 1500 Hampshire Pike
- 400 Finley Dr
- 1651 Manuka Ln
- 1422 Club House Dr
- 2206 Country Club Ln Unit B
- 4205 Tn-50
- 1809 Goldsberry Dr