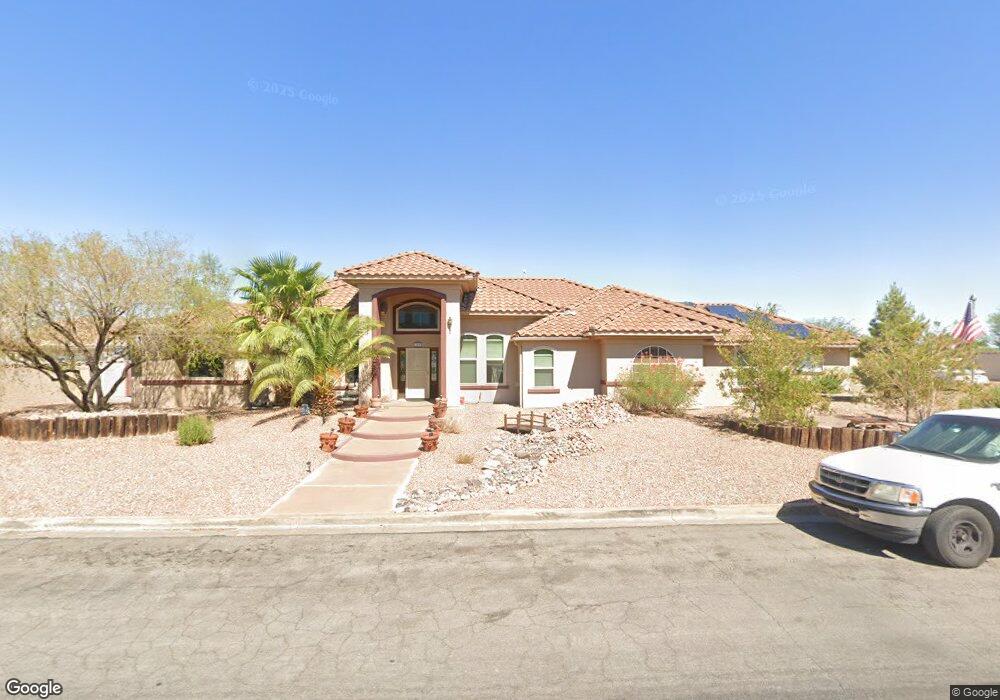
260 W Rochell Dr Henderson, NV 89015
Black Mountain NeighborhoodEstimated Value: $717,785 - $862,000
3
Beds
3
Baths
2,563
Sq Ft
$306/Sq Ft
Est. Value
About This Home
This home is located at 260 W Rochell Dr, Henderson, NV 89015 and is currently estimated at $783,946, approximately $305 per square foot. 260 W Rochell Dr is a home located in Clark County with nearby schools including Ulis Newton Elementary School, Lyal Burkholder Middle School, and Jack & Terry Mannion Middle School.
Ownership History
Date
Name
Owned For
Owner Type
Purchase Details
Closed on
Mar 19, 2024
Sold by
Rhodes Lee R and Rhodes Catharine C
Bought by
Rhodes Family Trust and Rhodes
Current Estimated Value
Purchase Details
Closed on
Oct 21, 2019
Sold by
Rhodes Lee R and Rhodes Cathy C
Bought by
Rhodes Lee R and Rhodes Catharine C
Home Financials for this Owner
Home Financials are based on the most recent Mortgage that was taken out on this home.
Original Mortgage
$418,365
Interest Rate
3.5%
Mortgage Type
VA
Purchase Details
Closed on
Jun 14, 2011
Sold by
Ladanyi Janis E
Bought by
Rhodes Lee R and Rhodes Cathy C
Home Financials for this Owner
Home Financials are based on the most recent Mortgage that was taken out on this home.
Original Mortgage
$309,796
Interest Rate
4.63%
Mortgage Type
VA
Purchase Details
Closed on
Aug 6, 2003
Sold by
Ladanyi Albert J and Ladanyi Janis E
Bought by
Ladanyi Albert J and Ladanyi Janis E
Purchase Details
Closed on
Feb 26, 1997
Sold by
Neilson Garland L and Neilson Gwen
Bought by
Ladanyi Albert John and Ladanyi Janis Eileen
Purchase Details
Closed on
Oct 30, 1996
Sold by
Weedman Robert B and Weedman Shannon J
Bought by
Neilson Garland L and Neilson Gwen
Create a Home Valuation Report for This Property
The Home Valuation Report is an in-depth analysis detailing your home's value as well as a comparison with similar homes in the area
Home Values in the Area
Average Home Value in this Area
Purchase History
| Date | Buyer | Sale Price | Title Company |
|---|---|---|---|
| Rhodes Family Trust | -- | None Listed On Document | |
| Rhodes Lee R | -- | Element Title Llc | |
| Rhodes Lee R | $299,900 | Fidelity National Title Las | |
| Ladanyi Albert J | -- | -- | |
| Ladanyi Albert John | $57,000 | Nevada Title Company | |
| Neilson Garland L | $47,000 | United Title |
Source: Public Records
Mortgage History
| Date | Status | Borrower | Loan Amount |
|---|---|---|---|
| Previous Owner | Rhodes Lee R | $418,365 | |
| Previous Owner | Rhodes Lee R | $309,796 |
Source: Public Records
Tax History Compared to Growth
Tax History
| Year | Tax Paid | Tax Assessment Tax Assessment Total Assessment is a certain percentage of the fair market value that is determined by local assessors to be the total taxable value of land and additions on the property. | Land | Improvement |
|---|---|---|---|---|
| 2025 | $3,506 | $214,468 | $66,500 | $147,968 |
| 2024 | $3,404 | $214,468 | $66,500 | $147,968 |
| 2023 | $3,404 | $195,123 | $56,000 | $139,123 |
| 2022 | $3,305 | $183,464 | $56,000 | $127,464 |
| 2021 | $3,209 | $170,485 | $49,000 | $121,485 |
| 2020 | $3,112 | $158,951 | $38,500 | $120,451 |
| 2019 | $3,022 | $153,766 | $35,000 | $118,766 |
| 2018 | $2,934 | $139,397 | $24,500 | $114,897 |
| 2017 | $3,788 | $130,679 | $24,500 | $106,179 |
| 2016 | $2,778 | $114,641 | $22,750 | $91,891 |
| 2015 | $2,773 | $88,045 | $15,750 | $72,295 |
| 2014 | $2,344 | $78,520 | $15,750 | $62,770 |
Source: Public Records
Map
Nearby Homes
- 230 W Rochell Dr
- 139 Aqua Commons Ln
- 461 S Chesapeake Way
- 240 W Fairway Rd
- 211 Viewmont Dr
- 130 W Fairway Rd
- 405 Box Elder Way
- 475 Annapolis Cir
- 468 Potomac St
- 478 Potomac St
- 111 E van Wagenen St
- 139 E van Wagenen St
- 0 None Unit 2690079
- 431 Opal Dr Unit 2
- 404 Viewmont Dr
- 441 Daylin Ct
- 611 E Fairway Rd
- 406 Palegold St
- 241 E Country Club Dr
- 211 W Atlantic Ave
- 271 W Sherwood Dr
- 250 W Rochell Dr
- 261 W Sherwood Dr
- 280 W Rochell Dr
- 445 Crestway Rd
- 261 W Rochell Dr
- 271 W Rochell Dr
- 440 Mountain View Rd
- 281 W Sherwood Dr
- 251 W Rochell Dr
- 281 W Rochell Dr
- 260 W Mulberry Dr
- 270 W Mulberry Dr
- 136 Laguna Commons Ln
- 240 W Rochell Dr
- 260 W Sherwood Dr
- 270 W Sherwood Dr
- 250 W Mulberry Dr
- 450 Crestway Rd
- 452 Crestway Rd