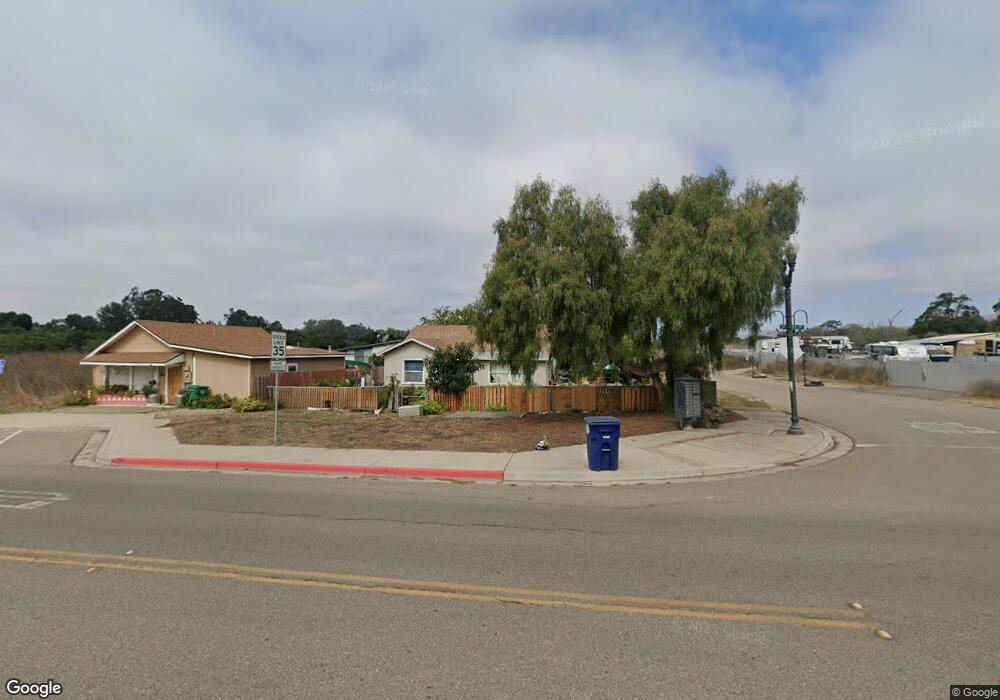
260 W Tefft St Nipomo, CA 93444
Estimated Value: $680,272
4
Beds
2
Baths
2,100
Sq Ft
$324/Sq Ft
Est. Value
About This Home
This home is located at 260 W Tefft St, Nipomo, CA 93444 and is currently estimated at $680,272, approximately $323 per square foot. 260 W Tefft St is a home located in San Luis Obispo County with nearby schools including Nipomo Elementary School, Mesa Middle School, and Nipomo High School.
Ownership History
Date
Name
Owned For
Owner Type
Purchase Details
Closed on
Mar 22, 2018
Sold by
Castaneda Carlos A and Carlos A Castaneda Jr Family T
Bought by
Romero Daniel Sergio and Romero Maria Lorena
Current Estimated Value
Home Financials for this Owner
Home Financials are based on the most recent Mortgage that was taken out on this home.
Original Mortgage
$337,500
Interest Rate
4.4%
Mortgage Type
New Conventional
Purchase Details
Closed on
Mar 21, 2017
Sold by
The Mt Real Estate Investments Llc
Bought by
Castaneda Carlos A
Purchase Details
Closed on
Jul 10, 2016
Sold by
Fragoza Roger
Bought by
The Mt Real Estate Investments Llc
Purchase Details
Closed on
Apr 29, 2013
Sold by
Tudela Mario R and Fragoza Roger
Bought by
Tudela Mario R and The Mrt Enterprises Trust
Purchase Details
Closed on
Dec 20, 2012
Sold by
George Patricia K and George Gay M
Bought by
Tudela Mario R and Fragoza Roger
Create a Home Valuation Report for This Property
The Home Valuation Report is an in-depth analysis detailing your home's value as well as a comparison with similar homes in the area
Home Values in the Area
Average Home Value in this Area
Purchase History
| Date | Buyer | Sale Price | Title Company |
|---|---|---|---|
| Romero Daniel Sergio | $450,000 | Fidelity National Title Co | |
| Castaneda Carlos A | $323,000 | First American Title Company | |
| The Mt Real Estate Investments Llc | -- | None Available | |
| Tudela Mario R | -- | None Available | |
| Tudela Mario R | $230,000 | First American Title Company |
Source: Public Records
Mortgage History
| Date | Status | Borrower | Loan Amount |
|---|---|---|---|
| Previous Owner | Romero Daniel Sergio | $337,500 |
Source: Public Records
Tax History Compared to Growth
Tax History
| Year | Tax Paid | Tax Assessment Tax Assessment Total Assessment is a certain percentage of the fair market value that is determined by local assessors to be the total taxable value of land and additions on the property. | Land | Improvement |
|---|---|---|---|---|
| 2025 | $5,267 | $512,018 | $256,009 | $256,009 |
| 2024 | $5,206 | $501,980 | $250,990 | $250,990 |
| 2023 | $5,206 | $492,138 | $246,069 | $246,069 |
| 2022 | $5,128 | $482,490 | $241,245 | $241,245 |
| 2021 | $5,118 | $473,030 | $236,515 | $236,515 |
| 2020 | $5,060 | $468,180 | $234,090 | $234,090 |
| 2019 | $5,029 | $459,000 | $229,500 | $229,500 |
| 2018 | $3,638 | $329,460 | $178,500 | $150,960 |
| 2017 | $2,697 | $244,036 | $159,154 | $84,882 |
| 2016 | $2,544 | $239,252 | $156,034 | $83,218 |
| 2015 | $2,507 | $235,659 | $153,691 | $81,968 |
| 2014 | $891 | $85,294 | $40,655 | $44,639 |
Source: Public Records
Map
Nearby Homes
- 1 W Branch St
- 90111003 W Price St
- 0 S Burton St
- 449 W Tefft St Unit 23
- 449 W Tefft St Unit 13
- 160 San Antonio Ln
- 400 N Oakglen Ave
- 150 E Chestnut St
- 412 N Mallagh St
- 189 E Tefft St
- 525 Grande Ave Unit D
- 285 E Tefft St
- 368 Avenida de Amigos
- 680 Hill St
- Mesa Plan at Hill Street Terraces - Hill Street Series
- Pacific Plan at Hill Street Terraces - Hill Street Series
- Monarch Plan at Hill Street Terraces - Hill Street Series
- Rancho Plan at Hill Street Terraces - Hill Street Series
- Dana Plan at Hill Street Terraces - Hill Street Series
- 450 Avenida de Socios Unit 12
- 260 W Tefft St Unit NIPO
- 255 S Wilson St
- 234 W Tefft St
- 255 N Wilson St
- 267 W Tefft St
- 230 W Tefft St
- 277 W Tefft St
- 277 W Tefft St Unit A&B
- 277 W Tefft St Unit D
- 277 W Tefft St Unit STE
- 257 W Tefft St
- 253 W Tefft St
- 205 W Tefft St
- 330 W Tefft St Unit H
- 330 W Tefft St Unit C
- 261 W Dana St
- 171 N Mallagh St
- 140 Mallagh St
- 323 W Tefft St