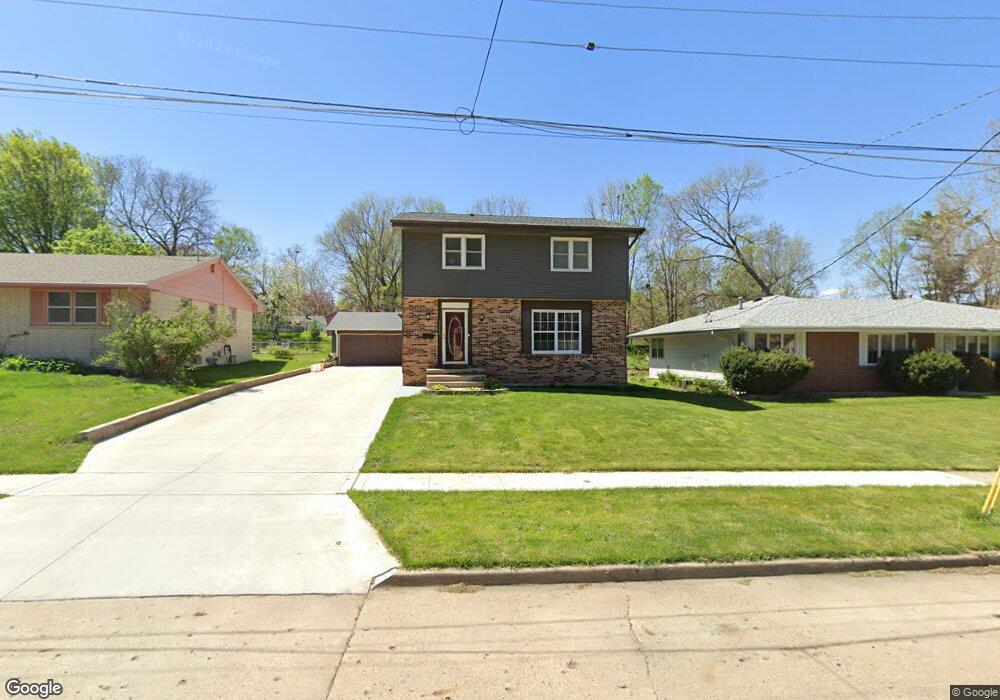
2600 54th St Des Moines, IA 50310
Merle Hay NeighborhoodEstimated Value: $271,000 - $314,000
4
Beds
2
Baths
1,540
Sq Ft
$187/Sq Ft
Est. Value
About This Home
This home is located at 2600 54th St, Des Moines, IA 50310 and is currently estimated at $288,562, approximately $187 per square foot. 2600 54th St is a home located in Polk County with nearby schools including Hillis Elementary School, Meredith Middle School, and Hoover High School.
Ownership History
Date
Name
Owned For
Owner Type
Purchase Details
Closed on
Feb 4, 2005
Sold by
Mcmanus Patrick J and Mcmanus Nancy K
Bought by
Memic Rasim and Memic Rasima
Current Estimated Value
Home Financials for this Owner
Home Financials are based on the most recent Mortgage that was taken out on this home.
Original Mortgage
$21,750
Interest Rate
5.22%
Mortgage Type
Stand Alone Second
Create a Home Valuation Report for This Property
The Home Valuation Report is an in-depth analysis detailing your home's value as well as a comparison with similar homes in the area
Home Values in the Area
Average Home Value in this Area
Purchase History
| Date | Buyer | Sale Price | Title Company |
|---|---|---|---|
| Memic Rasim | $144,500 | -- |
Source: Public Records
Mortgage History
| Date | Status | Borrower | Loan Amount |
|---|---|---|---|
| Closed | Memic Rasim | $21,750 | |
| Open | Memic Rasim | $116,000 |
Source: Public Records
Tax History Compared to Growth
Tax History
| Year | Tax Paid | Tax Assessment Tax Assessment Total Assessment is a certain percentage of the fair market value that is determined by local assessors to be the total taxable value of land and additions on the property. | Land | Improvement |
|---|---|---|---|---|
| 2025 | $4,554 | $268,700 | $54,700 | $214,000 |
| 2024 | $4,554 | $242,000 | $48,600 | $193,400 |
| 2023 | $4,622 | $242,000 | $48,600 | $193,400 |
| 2022 | $4,586 | $205,000 | $42,200 | $162,800 |
| 2021 | $4,506 | $205,000 | $42,200 | $162,800 |
| 2020 | $4,676 | $189,200 | $38,800 | $150,400 |
| 2019 | $4,294 | $189,200 | $38,800 | $150,400 |
| 2018 | $4,246 | $168,300 | $33,800 | $134,500 |
| 2017 | $3,972 | $168,300 | $33,800 | $134,500 |
| 2016 | $3,866 | $155,400 | $30,800 | $124,600 |
| 2015 | $3,866 | $155,400 | $30,800 | $124,600 |
| 2014 | $3,582 | $148,800 | $29,000 | $119,800 |
Source: Public Records
Map
Nearby Homes