2600 Edgerock Rd Unit 2 Reno, NV 89519
Lakeridge NeighborhoodEstimated Value: $926,713 - $1,199,000
3
Beds
3
Baths
2,822
Sq Ft
$367/Sq Ft
Est. Value
About This Home
This home is located at 2600 Edgerock Rd Unit 2, Reno, NV 89519 and is currently estimated at $1,036,178, approximately $367 per square foot. 2600 Edgerock Rd Unit 2 is a home located in Washoe County with nearby schools including Caughlin Ranch Elementary School, Darrell C Swope Middle School, and Reno High School.
Ownership History
Date
Name
Owned For
Owner Type
Purchase Details
Closed on
Feb 11, 2015
Sold by
Williams Ronald R and Williams Geneva Bryant
Bought by
Williams Geneva Bryant and Second Restatement Of The Geneva Bryant
Current Estimated Value
Purchase Details
Closed on
Oct 7, 2004
Sold by
Corcoran Harold S and Corcoran Joyce L
Bought by
Williams Ronald R and Williams Geneva Bryant
Home Financials for this Owner
Home Financials are based on the most recent Mortgage that was taken out on this home.
Original Mortgage
$500,000
Outstanding Balance
$114,649
Interest Rate
3.75%
Mortgage Type
Unknown
Estimated Equity
$921,529
Purchase Details
Closed on
Jan 7, 1994
Sold by
Lakeridge Point Joint Venture
Bought by
Corcoran Harold S and Corcoran Joyce L
Home Financials for this Owner
Home Financials are based on the most recent Mortgage that was taken out on this home.
Original Mortgage
$203,000
Interest Rate
7.38%
Create a Home Valuation Report for This Property
The Home Valuation Report is an in-depth analysis detailing your home's value as well as a comparison with similar homes in the area
Home Values in the Area
Average Home Value in this Area
Purchase History
| Date | Buyer | Sale Price | Title Company |
|---|---|---|---|
| Williams Geneva Bryant | -- | None Available | |
| Williams Ronald R | $685,000 | Stewart Title Of Northern Nv | |
| Corcoran Harold S | $285,000 | First Centennial Title Co |
Source: Public Records
Mortgage History
| Date | Status | Borrower | Loan Amount |
|---|---|---|---|
| Open | Williams Ronald R | $500,000 | |
| Previous Owner | Corcoran Harold S | $203,000 |
Source: Public Records
Tax History Compared to Growth
Tax History
| Year | Tax Paid | Tax Assessment Tax Assessment Total Assessment is a certain percentage of the fair market value that is determined by local assessors to be the total taxable value of land and additions on the property. | Land | Improvement |
|---|---|---|---|---|
| 2025 | $4,252 | $183,389 | $75,390 | $107,999 |
| 2024 | $4,252 | $179,792 | $68,040 | $111,752 |
| 2023 | $4,134 | $169,356 | $68,040 | $101,316 |
| 2022 | $4,012 | $154,522 | $67,914 | $86,608 |
| 2021 | $3,897 | $128,781 | $41,748 | $87,033 |
| 2020 | $3,778 | $130,624 | $41,748 | $88,876 |
| 2019 | $3,667 | $126,615 | $41,062 | $85,553 |
| 2018 | $3,560 | $116,693 | $32,340 | $84,353 |
| 2017 | $3,457 | $112,804 | $28,665 | $84,139 |
| 2016 | $3,370 | $109,623 | $24,570 | $85,053 |
| 2015 | $3,364 | $106,740 | $21,084 | $85,656 |
| 2014 | -- | $105,366 | $18,564 | $86,802 |
| 2013 | -- | $101,187 | $14,994 | $86,193 |
Source: Public Records
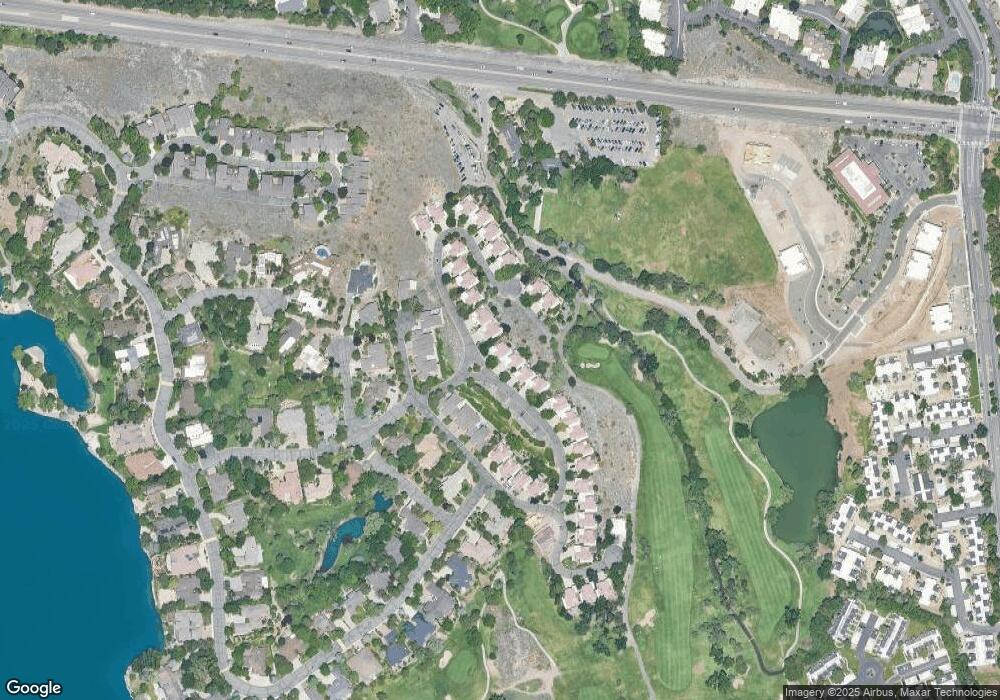
Map
Nearby Homes
- 2220 Stone Mountain Cir Unit 2
- 2531 Edgerock Rd
- 2556 Edgerock Rd
- 2330 Crows Nest Pkwy
- 2570 Spinnaker Dr
- 6057 Kelly Heights Way Unit 16
- 1509 Golf Club Dr Unit Hilltop 13
- 1533 Golf Club Dr Unit Hilltop 7
- 1545 Golf Club Dr
- 1545 Golf Club Dr Unit 4
- 4947 Lakeridge Terrace W
- 6161 Wycliffe Cir
- 4833 Lakeridge Terrace W
- 4811 Lakeridge Terrace W
- 4970 Plumas St
- 4900 Plumas St Unit A113
- 2108 Chicory Way Unit 2108A
- 4740 Plumas St
- 2521 Lake Ridge Shores Cir
- 6302 Green Ranch Rd
- 2606 Edgerock Rd
- 2596 Edgerock Rd
- 2612 Edgerock Rd
- 2588 Edgerock Rd
- 2618 Edgerock Rd
- 2580 Edgerock Rd
- 2511 Edgerock Rd
- 2521 Edgerock Rd
- 2620 Rockview Dr
- 2610 Rockview Dr
- 2572 Edgerock Rd
- 2240 Stone Mountain Cir
- 2630 Rockview Dr Unit 2
- 2624 Edgerock Rd
- 2640 Rockview Dr
- 2564 Edgerock Rd
- 2630 Edgerock Rd
- 2650 Rockview Dr
- 2535 Edgerock Rd
- 2200 Stone Mountain Cir