2600 Elm St Bellingham, WA 98225
Columbia NeighborhoodEstimated payment $4,846/month
Highlights
- Property is near public transit
- Territorial View
- Corner Lot
- Bellingham High School Rated A
- Wood Flooring
- No HOA
About This Home
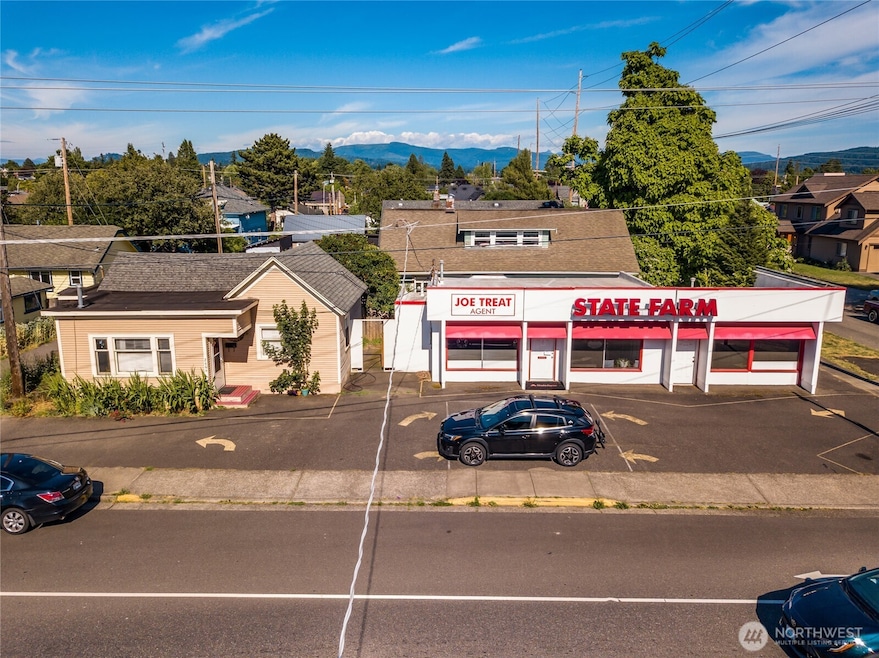
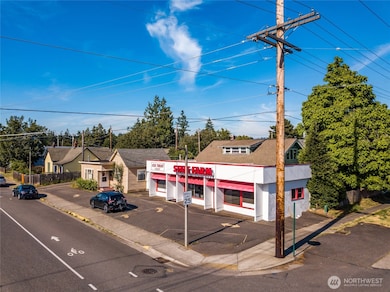
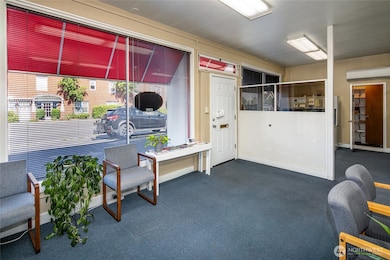
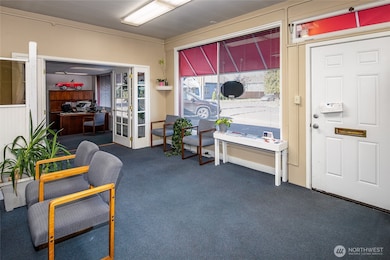
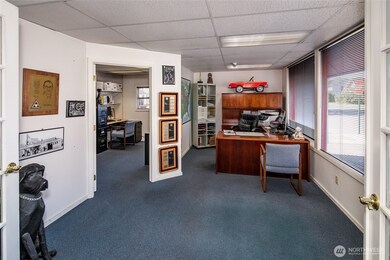
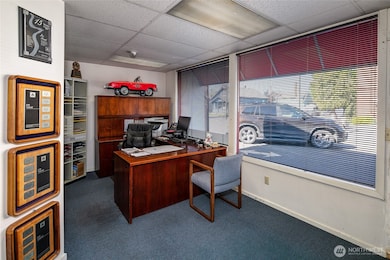
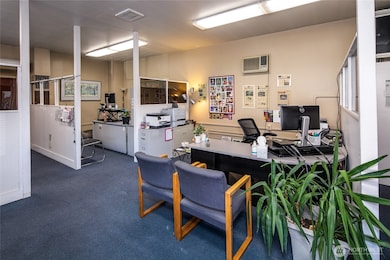
Two rental properties, or your home and 5 steps to your office! The property consists of a 850 square foot residence with 1 bedroom (small 2nd room could be 2nd bedroom) and one bathroom home, plus a 976 square foot office building in the Fountain/Columbia neighborhood. Seven off street parking spaces. Office has 2 front entrances and could be two units with a shared bathroom. Great location with close proximity to many services.
Source: Northwest Multiple Listing Service (NWMLS)
MLS#: 2430892
Home Details
Home Type
- Single Family
Est. Annual Taxes
- $2,873
Year Built
- Built in 1898
Lot Details
- 4,356 Sq Ft Lot
- Corner Lot
- Level Lot
- Property is in average condition
Home Design
- Poured Concrete
- Composition Roof
- Bitumen Roof
- Wood Siding
Interior Spaces
- 850 Sq Ft Home
- 1-Story Property
- Territorial Views
Kitchen
- Stove
- Dishwasher
Flooring
- Wood
- Carpet
- Vinyl
Bedrooms and Bathrooms
- 2 Main Level Bedrooms
- Bathroom on Main Level
- 1 Full Bathroom
Laundry
- Dryer
- Washer
Parking
- Driveway
- Off-Street Parking
Location
- Property is near public transit
- Property is near a bus stop
Utilities
- Ductless Heating Or Cooling System
- Private Water Source
- Water Heater
Community Details
- No Home Owners Association
- Columbia Subdivision
Listing and Financial Details
- Legal Lot and Block 7 / 155
- Assessor Parcel Number 3802245151420000
Map
Home Values in the Area
Average Home Value in this Area
Tax History
| Year | Tax Paid | Tax Assessment Tax Assessment Total Assessment is a certain percentage of the fair market value that is determined by local assessors to be the total taxable value of land and additions on the property. | Land | Improvement |
|---|---|---|---|---|
| 2024 | $2,732 | $350,717 | $217,649 | $133,068 |
| 2023 | $2,732 | $350,717 | $217,649 | $133,068 |
| 2022 | $2,574 | $315,961 | $196,080 | $119,881 |
| 2021 | $2,728 | $277,159 | $172,000 | $105,159 |
| 2020 | $1,997 | $277,159 | $172,000 | $105,159 |
| 2019 | $1,850 | $196,166 | $96,664 | $99,502 |
| 2018 | $2,134 | $182,204 | $89,784 | $92,420 |
| 2017 | $2,042 | $179,656 | $88,528 | $91,128 |
| 2016 | $1,961 | $179,656 | $88,528 | $91,128 |
| 2015 | $1,969 | $179,656 | $88,528 | $91,128 |
| 2014 | -- | $174,525 | $86,000 | $88,525 |
| 2013 | -- | $176,568 | $84,280 | $92,288 |
Property History
| Date | Event | Price | List to Sale | Price per Sq Ft |
|---|---|---|---|---|
| 10/17/2025 10/17/25 | Price Changed | $875,000 | -7.4% | $1,029 / Sq Ft |
| 09/08/2025 09/08/25 | For Sale | $945,000 | -- | $1,112 / Sq Ft |
Purchase History
| Date | Type | Sale Price | Title Company |
|---|---|---|---|
| Interfamily Deed Transfer | -- | None Available | |
| Quit Claim Deed | -- | -- | |
| Warranty Deed | $160,000 | Island Title |
Mortgage History
| Date | Status | Loan Amount | Loan Type |
|---|---|---|---|
| Previous Owner | $137,090 | Commercial |
Source: Northwest Multiple Listing Service (NWMLS)
MLS Number: 2430892
APN: 380224-515142-0000
Disclaimer: Certain information contained herein is derived from information provided by parties other than Homes.com. All information provided is deemed reliable, but is not guaranteed to be accurate and should be independently verified.
![]() All data is obtained from various sources and may not have been verified by broker or MLS GRID. Supplied Open House Information is subject to change without notice. All information should be independently reviewed and verified for accuracy. Properties may or may not be listed by the office/agent presenting the information. Listing information is provided by the Northwest Multiple Listing Service (NWMLS). Property information is based on available data that may include MLS information, county records, and other sources. Listings marked with the 3 tree icon and provided by NWMLS. All properties are subject to prior sale or withdrawal. IDX information is provided exclusively for consumers’ personal noncommercial use, that it may not be used for any purpose other than to identify prospective properties consumers may be interested in purchasing, that the data is deemed reliable but is not guaranteed by MLS GRID. ©2025 NWMLS.
All data is obtained from various sources and may not have been verified by broker or MLS GRID. Supplied Open House Information is subject to change without notice. All information should be independently reviewed and verified for accuracy. Properties may or may not be listed by the office/agent presenting the information. Listing information is provided by the Northwest Multiple Listing Service (NWMLS). Property information is based on available data that may include MLS information, county records, and other sources. Listings marked with the 3 tree icon and provided by NWMLS. All properties are subject to prior sale or withdrawal. IDX information is provided exclusively for consumers’ personal noncommercial use, that it may not be used for any purpose other than to identify prospective properties consumers may be interested in purchasing, that the data is deemed reliable but is not guaranteed by MLS GRID. ©2025 NWMLS.
Based on information submitted to the MLS GRID
- 2500 Meridian St
- 2805 Walnut St
- 1800 J St
- 3008 Meridian St
- 2321 Williams St
- 1410 J St
- 1315 Astor St
- 1200 W Holly St
- 2218 Jaeger St
- 2500 Cornwall Ave
- 1508 E Maplewood Ave
- 2624 Hampton Place
- 2019 Cornwall Ave
- 2432 Grant St
- 2111 Franklin St
- 607 E Illinois St
- 2812 Nome St
- 1025 Granary Ave Unit 503
- 1025 Granary Ave Unit 404
- 1025 Granary Ave Unit 306
- 1818 D St
- 2605 W Maplewood Ave
- 102 Ohio St Unit 204
- 102 Ohio St Unit 203
- 3408-3412 Northwest Ave
- 2600 Alderwood Ave
- 1010 Railroad Ave
- 3930 Affinity Ln
- 1205 N Garden St Unit 304
- 2034 Moore St
- 929 N State St
- 839 N State St
- 900 N Forest St
- 918 Billy Frank Jr St
- 1471 Moore St
- 3928 Northwest Ave
- 3126 Racine St
- 418 W Bakerview Rd
- 135 Prince Ave Unit 139-202
- 3310 Alderwood Ave
