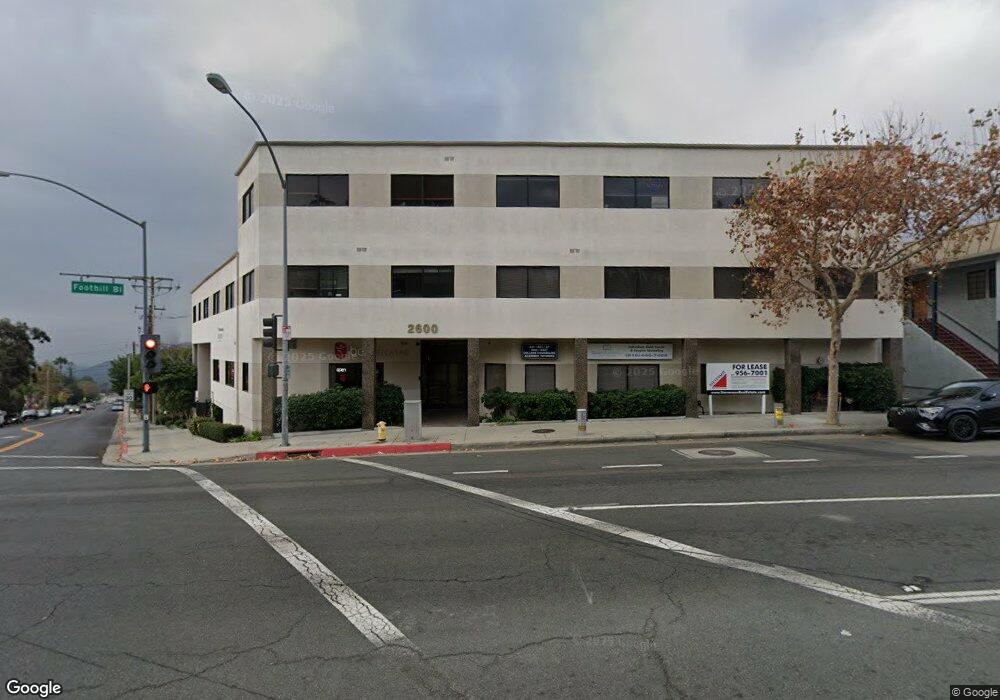
2600 Foothill Blvd Unit 301 La Crescenta-Montrose, CA 91214
Estimated Value: $3,617,343
--
Bed
--
Bath
37,757
Sq Ft
$96/Sq Ft
Est. Value
About This Home
This home is located at 2600 Foothill Blvd Unit 301, La Crescenta-Montrose, CA 91214 and is currently priced at $3,617,343, approximately $95 per square foot. 2600 Foothill Blvd Unit 301 is a home located in Los Angeles County with nearby schools including La Crescenta Elementary School, Rosemont Middle School, and Crescenta Valley High School.
Ownership History
Date
Name
Owned For
Owner Type
Purchase Details
Closed on
May 5, 2023
Sold by
Voskanian Gevorg and Voskanian Arax
Bought by
Gav Offices Llc
Current Estimated Value
Purchase Details
Closed on
Oct 3, 2002
Sold by
Vartany Armen and Vartany Alina
Bought by
Voskanian Gevorg and Voskanian Arax
Home Financials for this Owner
Home Financials are based on the most recent Mortgage that was taken out on this home.
Original Mortgage
$800,000
Interest Rate
6.05%
Mortgage Type
Construction
Purchase Details
Closed on
Dec 27, 1999
Sold by
Trust Post Mala And Diana Trs Post Famil
Bought by
Voskanian Gevorg and Voskanian Arax
Purchase Details
Closed on
Jan 27, 1998
Sold by
Trust Post Mala And Diana Trs Post Famil
Bought by
Post Mala and Post Diana
Create a Home Valuation Report for This Property
The Home Valuation Report is an in-depth analysis detailing your home's value as well as a comparison with similar homes in the area
Home Values in the Area
Average Home Value in this Area
Purchase History
| Date | Buyer | Sale Price | Title Company |
|---|---|---|---|
| Gav Offices Llc | -- | None Listed On Document | |
| Voskanian Gevorg | -- | Commonwealth Land Title Co | |
| Voskanian Gevorg | $505,000 | Old Republic Title Company | |
| Post Mala | -- | -- |
Source: Public Records
Mortgage History
| Date | Status | Borrower | Loan Amount |
|---|---|---|---|
| Previous Owner | Voskanian Gevorg | $800,000 |
Source: Public Records
Tax History Compared to Growth
Tax History
| Year | Tax Paid | Tax Assessment Tax Assessment Total Assessment is a certain percentage of the fair market value that is determined by local assessors to be the total taxable value of land and additions on the property. | Land | Improvement |
|---|---|---|---|---|
| 2025 | $117,577 | $6,133,805 | $3,129,525 | $3,004,280 |
| 2024 | $117,577 | $10,200,000 | $6,426,000 | $3,774,000 |
| 2023 | $78,956 | $6,670,830 | $3,497,604 | $3,173,226 |
| 2022 | $38,082 | $3,153,121 | $846,606 | $2,306,515 |
| 2021 | $37,305 | $3,091,296 | $830,006 | $2,261,290 |
| 2019 | $35,927 | $2,999,609 | $805,389 | $2,194,220 |
| 2018 | $35,176 | $2,940,795 | $789,598 | $2,151,197 |
| 2016 | $33,341 | $2,826,602 | $758,938 | $2,067,664 |
| 2015 | $32,691 | $2,784,145 | $747,539 | $2,036,606 |
| 2014 | $32,559 | $2,729,608 | $732,896 | $1,996,712 |
Source: Public Records
Map
Nearby Homes
- 2619 Mary St
- 2543 Cross St
- 2614 Mary St
- 2700 Prospect Ave
- 2512 Prospect Ave
- 4328 Sunset Ave
- 4133 La Crescenta Ave
- 2434 Prospect Ave
- 2745 Montrose Ave Unit 102
- 2817 Montrose Ave
- 2754 Franklin St
- 2905 Montrose Ave Unit 318
- 2754 Montrose Ave
- 2944 Mayfield Ave
- 2806 Manhattan Ave
- 4543 Rockland Place
- 2927 Piedmont Ave
- 3928 La Crescenta Ave
- 2941 Mary St
- 4940 Ocean View Blvd
- 2600 Foothill Blvd Unit 202
- 2600 Foothill Blvd Unit 105
- 2600 Foothill Blvd Unit 303
- 2600 Foothill Blvd
- 2600 Foothill Blvd Unit 204
- 2623 Mary St
- 4455 Rosemont Ave
- 2606 Foothill Blvd Unit A
- 2606 Foothill Blvd Unit SUITE B
- 2606 Foothill Blvd Unit SUITE A
- 2606 Foothill Blvd Unit B
- 2606 Foothill Blvd Unit Dnstr
- 2606 Foothill Blvd Unit Downsta
- 2606 Foothill Blvd
- 2627 Mary St
- 2633 Mary St
- 2605 Mary St
- 2637 Mary St
- 4454 Rosemont Ave
- 2620 Foothill Blvd