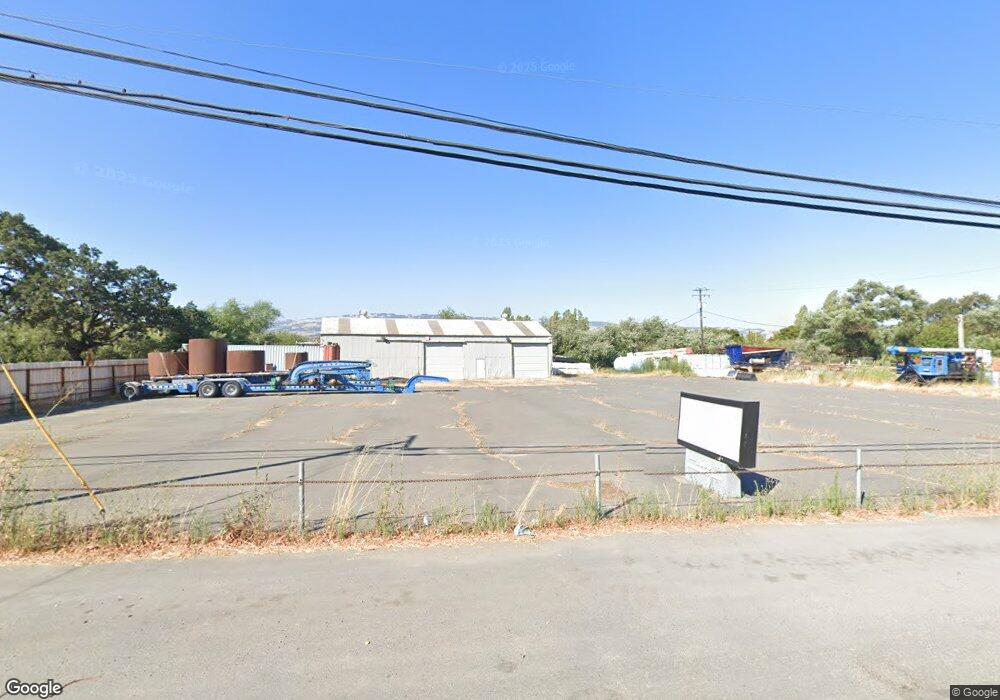
2600 Petaluma Blvd N Petaluma, CA 94952
Estimated Value: $1,661,935
--
Bed
--
Bath
2,400
Sq Ft
$692/Sq Ft
Est. Value
About This Home
This home is located at 2600 Petaluma Blvd N, Petaluma, CA 94952 and is currently estimated at $1,661,935, approximately $692 per square foot. 2600 Petaluma Blvd N is a home located in Sonoma County with nearby schools including Petaluma Junior High School, Petaluma High School, and Cinnabar Charter School.
Ownership History
Date
Name
Owned For
Owner Type
Purchase Details
Closed on
Apr 9, 2014
Sold by
Azevedo Paul W and Azevedo Brenda L
Bought by
2600 Petaluma Blvd North Llc
Current Estimated Value
Purchase Details
Closed on
Dec 17, 2012
Sold by
Respini Dennis J
Bought by
Azevedo Paul W and Azevedo Brenda L
Purchase Details
Closed on
Jul 6, 2010
Sold by
Respini Dennis J
Bought by
Liv Respini Dennis J
Purchase Details
Closed on
Nov 16, 1998
Sold by
Respini Dennis J and Crowell Paulette Ann
Bought by
Respini Dennis J
Home Financials for this Owner
Home Financials are based on the most recent Mortgage that was taken out on this home.
Original Mortgage
$162,500
Interest Rate
6.42%
Mortgage Type
Commercial
Create a Home Valuation Report for This Property
The Home Valuation Report is an in-depth analysis detailing your home's value as well as a comparison with similar homes in the area
Home Values in the Area
Average Home Value in this Area
Purchase History
| Date | Buyer | Sale Price | Title Company |
|---|---|---|---|
| 2600 Petaluma Blvd North Llc | -- | None Available | |
| Azevedo Paul W | $735,000 | Fidelity National Title Co | |
| Liv Respini Dennis J | -- | None Available | |
| Respini Dennis J | $200,000 | Pacific Coast Title Company |
Source: Public Records
Mortgage History
| Date | Status | Borrower | Loan Amount |
|---|---|---|---|
| Previous Owner | Respini Dennis J | $162,500 |
Source: Public Records
Tax History Compared to Growth
Tax History
| Year | Tax Paid | Tax Assessment Tax Assessment Total Assessment is a certain percentage of the fair market value that is determined by local assessors to be the total taxable value of land and additions on the property. | Land | Improvement |
|---|---|---|---|---|
| 2025 | $10,001 | $905,089 | $554,138 | $350,951 |
| 2024 | $10,001 | $887,343 | $543,273 | $344,070 |
| 2023 | $10,001 | $869,945 | $532,621 | $337,324 |
| 2022 | $9,725 | $852,888 | $522,178 | $330,710 |
| 2021 | $9,504 | $836,166 | $511,940 | $324,226 |
| 2020 | $9,567 | $827,593 | $506,691 | $320,902 |
| 2019 | $9,417 | $811,366 | $496,756 | $314,610 |
| 2018 | $9,159 | $795,458 | $487,016 | $308,442 |
| 2017 | $9,014 | $779,862 | $477,467 | $302,395 |
| 2016 | $8,737 | $764,571 | $468,105 | $296,466 |
| 2015 | $8,537 | $753,087 | $461,074 | $292,013 |
| 2014 | $8,222 | $738,336 | $452,043 | $286,293 |
Source: Public Records
Map
Nearby Homes
- 518 Vina Rose Dr
- 36 N Napa Dr
- 20 E Napa Dr
- 1003 Sonoma Ct
- 594 Sonoma Dr
- 829 Winton Dr
- 717 N Mcdowell Blvd Unit 111
- 717 N Mcdowell Blvd Unit 511
- 717 N Mcdowell Blvd Unit 201
- 1501 Florence Way
- 1407 Woodside Cir
- 628 Nikki Dr
- 1544 Crown Rd
- 116 Marvin Ct
- 1441 Woodside Cir
- 1548 Royal Oak Dr
- 1463 Woodside Cir
- 71 Candlewood Dr
- 20 Oakwood Dr
- 1252 Petaluma Blvd N
- 2604 Petaluma Blvd N
- 2685 Petaluma Blvd N
- 2595 Petaluma Blvd N
- 2921 Petaluma Blvd N
- 46 Gossage Ave
- 287 Gossage Ave
- 155 Gossage Ave
- 719 Petaluma Blvd N
- 2447 Petaluma Blvd N
- 2925 Petaluma Blvd N
- 299 Gossage Ave
- 2437 Petaluma Blvd N
- 2337 Petaluma Blvd N
- 215 Gossage Ave
- 333 Gossage Ave
- 2441 Petaluma Blvd N
- 290 Gossage Ave
- 2453 Petaluma Blvd N
- 2263 Petaluma Blvd N
- 2445 Petaluma Blvd N