2600 Shawnee Rd Auburn, CA 95603
Estimated Value: $527,000 - $594,000
2
Beds
2
Baths
1,392
Sq Ft
$403/Sq Ft
Est. Value
About This Home
This home is located at 2600 Shawnee Rd, Auburn, CA 95603 and is currently estimated at $560,373, approximately $402 per square foot. 2600 Shawnee Rd is a home located in Placer County with nearby schools including Auburn Elementary School, Placer High School, and EV Cain Middle.
Ownership History
Date
Name
Owned For
Owner Type
Purchase Details
Closed on
Feb 15, 2013
Sold by
Morrill Tyree
Bought by
Morrill Tyree
Current Estimated Value
Home Financials for this Owner
Home Financials are based on the most recent Mortgage that was taken out on this home.
Original Mortgage
$269,400
Outstanding Balance
$187,890
Interest Rate
3.36%
Mortgage Type
New Conventional
Estimated Equity
$372,483
Purchase Details
Closed on
Dec 23, 2008
Sold by
Morrill Gail M
Bought by
Morrill Tyree
Home Financials for this Owner
Home Financials are based on the most recent Mortgage that was taken out on this home.
Original Mortgage
$279,500
Interest Rate
6.1%
Mortgage Type
Stand Alone Refi Refinance Of Original Loan
Purchase Details
Closed on
Feb 10, 1999
Sold by
Meredith Bob and Meredith Dolores
Bought by
Morrill Tyree H and Morrill Gail M
Create a Home Valuation Report for This Property
The Home Valuation Report is an in-depth analysis detailing your home's value as well as a comparison with similar homes in the area
Purchase History
| Date | Buyer | Sale Price | Title Company |
|---|---|---|---|
| Morrill Tyree | -- | Fidelity National Title Comp | |
| Morrill Tyree | -- | North American Title Company | |
| Morrill Tyree H | $20,000 | North American Title Guarant |
Source: Public Records
Mortgage History
| Date | Status | Borrower | Loan Amount |
|---|---|---|---|
| Open | Morrill Tyree | $269,400 | |
| Closed | Morrill Tyree | $279,500 |
Source: Public Records
Tax History
| Year | Tax Paid | Tax Assessment Tax Assessment Total Assessment is a certain percentage of the fair market value that is determined by local assessors to be the total taxable value of land and additions on the property. | Land | Improvement |
|---|---|---|---|---|
| 2025 | $1,964 | $190,204 | $79,717 | $110,487 |
| 2023 | $1,964 | $182,820 | $76,622 | $106,198 |
| 2022 | $1,931 | $179,236 | $75,120 | $104,116 |
| 2021 | $1,862 | $175,723 | $73,648 | $102,075 |
| 2020 | $1,848 | $173,922 | $72,893 | $101,029 |
| 2019 | $1,813 | $170,513 | $71,464 | $99,049 |
| 2018 | $1,717 | $167,170 | $70,063 | $97,107 |
| 2017 | $1,686 | $163,893 | $68,690 | $95,203 |
| 2016 | $1,650 | $160,681 | $67,344 | $93,337 |
| 2015 | $1,610 | $158,268 | $66,333 | $91,935 |
| 2014 | $1,585 | $155,169 | $65,034 | $90,135 |
Source: Public Records
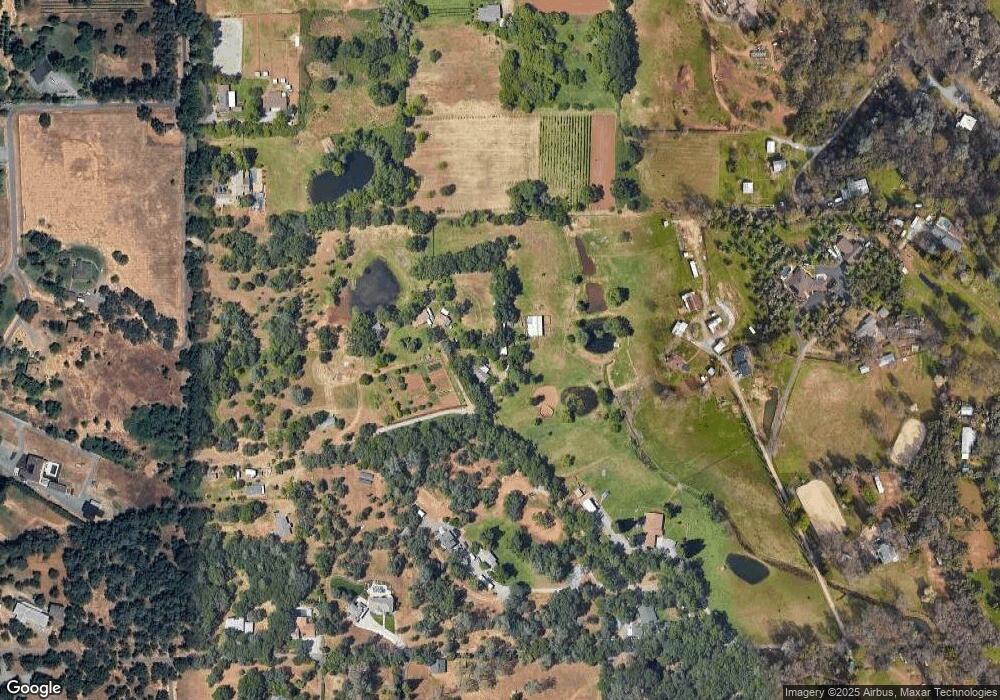
Map
Nearby Homes
- 10747 Mount Vernon Rd
- 11260 Scofield Way
- 11355 Spur Ln
- 2620 Vineyard Dr
- 2213 Country Villa Ct Unit 22
- 11010 Tahoe St
- 3775 Bell Rd
- 3740 Bell Rd
- 11765 Jones St
- 1240 Live Oak Ln
- 3222 Fortune Ct
- 8380 Chili Hill Rd
- 3277 Professional Dr
- 1605 Grass Valley Hwy Unit 70
- 1605 Grass Valley Hwy Unit 62
- 1605 Grass Valley Hwy
- 1605 Grass Valley Hwy Unit 54
- 1605 Grass Valley Hwy Unit 92
- 29 Larkspur Ave
- 99 Marigold Ave
- 2620 Shawnee Rd
- 2571 Shawnee Rd
- 2545 Frontier Rd
- 2529 Frontier Rd
- 2680 Shawnee Rd
- 9925 Stoney Ridge Rd
- 2672 Shawnee Rd
- 0 Shawnee Rd
- 2549 Frontier Rd
- 2515 Frontier Rd
- 2600 Shanley Rd
- 9915 Stoney Ridge Rd
- 2559 Frontier Rd
- 9899 Stoney Ridge Rd
- 10390 Mount Vernon Rd
- 2680 Shanley Rd
- 2476 Frontier Rd
- 2555 Frontier Rd
- 9900 Stoney Ridge Rd
- 9950 Stoney Ridge Rd
Your Personal Tour Guide
Ask me questions while you tour the home.