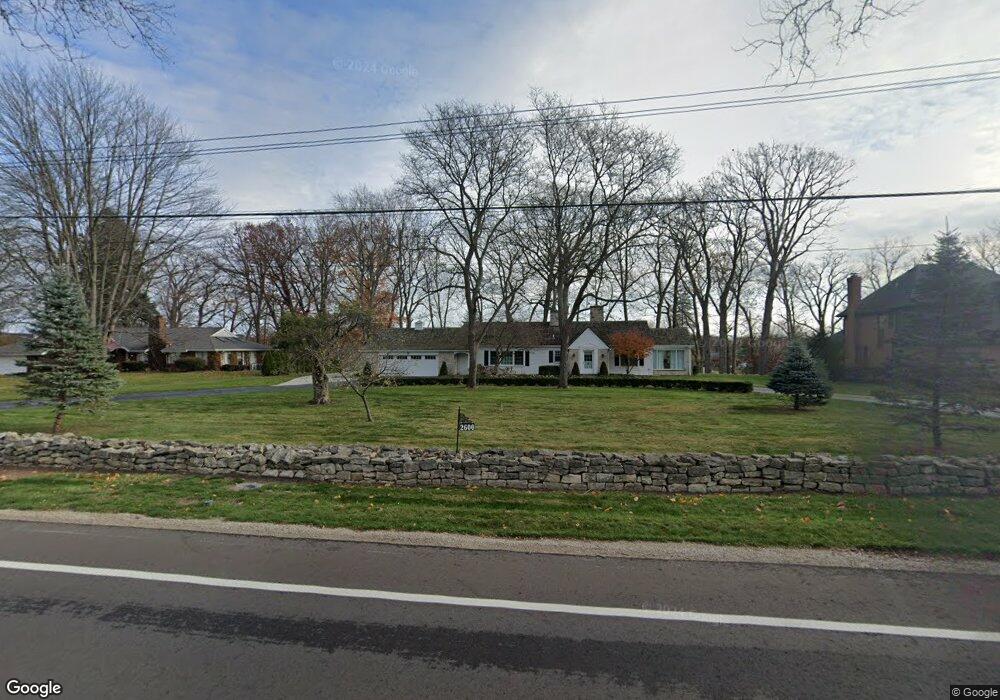
2600 Strawberry Ln Port Huron, MI 48060
Estimated Value: $444,000 - $733,000
2
Beds
3
Baths
2,900
Sq Ft
$197/Sq Ft
Est. Value
About This Home
This home is located at 2600 Strawberry Ln, Port Huron, MI 48060 and is currently estimated at $572,092, approximately $197 per square foot. 2600 Strawberry Ln is a home located in St. Clair County with nearby schools including Michigamme Elementary School, Central Middle School, and Port Huron High School.
Ownership History
Date
Name
Owned For
Owner Type
Purchase Details
Closed on
Jan 7, 2020
Sold by
Smith Michael D and Smith Donna M
Bought by
Ulmer Dana
Current Estimated Value
Home Financials for this Owner
Home Financials are based on the most recent Mortgage that was taken out on this home.
Original Mortgage
$337,500
Outstanding Balance
$298,195
Interest Rate
3.6%
Mortgage Type
New Conventional
Estimated Equity
$273,897
Purchase Details
Closed on
Dec 20, 2019
Sold by
Smith Michael D and Smith Donna M
Bought by
Ulmer Dana
Home Financials for this Owner
Home Financials are based on the most recent Mortgage that was taken out on this home.
Original Mortgage
$337,500
Outstanding Balance
$298,195
Interest Rate
3.6%
Mortgage Type
New Conventional
Estimated Equity
$273,897
Purchase Details
Closed on
Jun 6, 2011
Sold by
Moak Robert E
Bought by
Smith Michael D and Smith Donna M
Create a Home Valuation Report for This Property
The Home Valuation Report is an in-depth analysis detailing your home's value as well as a comparison with similar homes in the area
Home Values in the Area
Average Home Value in this Area
Purchase History
| Date | Buyer | Sale Price | Title Company |
|---|---|---|---|
| Ulmer Dana | $375,000 | Ata National Title Group | |
| Ulmer Dana | $375,000 | Ata National Title Group | |
| Smith Michael D | $250,000 | None Available |
Source: Public Records
Mortgage History
| Date | Status | Borrower | Loan Amount |
|---|---|---|---|
| Open | Ulmer Dana | $337,500 | |
| Closed | Ulmer Dana | $337,500 |
Source: Public Records
Tax History Compared to Growth
Tax History
| Year | Tax Paid | Tax Assessment Tax Assessment Total Assessment is a certain percentage of the fair market value that is determined by local assessors to be the total taxable value of land and additions on the property. | Land | Improvement |
|---|---|---|---|---|
| 2025 | $7,009 | $257,300 | $0 | $0 |
| 2024 | $3,688 | $237,200 | $0 | $0 |
| 2023 | $3,403 | $242,700 | $0 | $0 |
| 2022 | $6,289 | $215,100 | $0 | $0 |
| 2021 | $8,890 | $184,400 | $0 | $0 |
| 2020 | $8,890 | $172,300 | $0 | $172,300 |
| 2019 | $4,463 | $151,700 | $0 | $0 |
| 2018 | $4,358 | $151,700 | $0 | $0 |
| 2017 | $4,261 | $151,300 | $0 | $0 |
| 2016 | $2,207 | $151,300 | $0 | $0 |
| 2015 | -- | $142,900 | $79,400 | $63,500 |
| 2014 | -- | $128,200 | $79,400 | $48,800 |
| 2013 | -- | $122,300 | $0 | $0 |
Source: Public Records
Map
Nearby Homes
- 2610 Strawberry Ln
- 2475 Sharon Ln
- 2549 Riverwood Dr
- 2838 Elmwood St
- 3228 Turnberry
- 3196 Oakwood Dr
- 2857 Riverside Dr
- 3409 Ancient Dr
- 2421 Hancock St
- 3335 W Water St
- 3408 N Burwick Dr
- 2301 Water St
- 2428 20th Ave
- 2812 19th Ave
- 3145 Monticello Dr
- 0000 Water St
- 2835 17th Ave
- 2007 Hancock St
- 3515 Strawberry Ln
- V/L #4 Water St
- 2720 Strawberry Ln
- 2590 Strawberry Ln
- 2736 Strawberry Ln
- 2584 Strawberry Ln
- 2615 Strawberry Ln
- 2701 Strawberry Ln
- 2719 Strawberry Ln
- 2700 Strawberry Ln
- 2733 Strawberry Ln
- 2587 Strawberry Ln
- 2580 Strawberry Ln
- 2790 Strawberry Ln
- 2737 Strawberry Ln
- 2591 Strawberry Ln
- 2725 Strawberry Ln
- 2800 Strawberry Ln
- 2583 Strawberry Ln
- 2578 Strawberry Ln
- 2830 Strawberry Ln
- 2851 Strawberry Ln