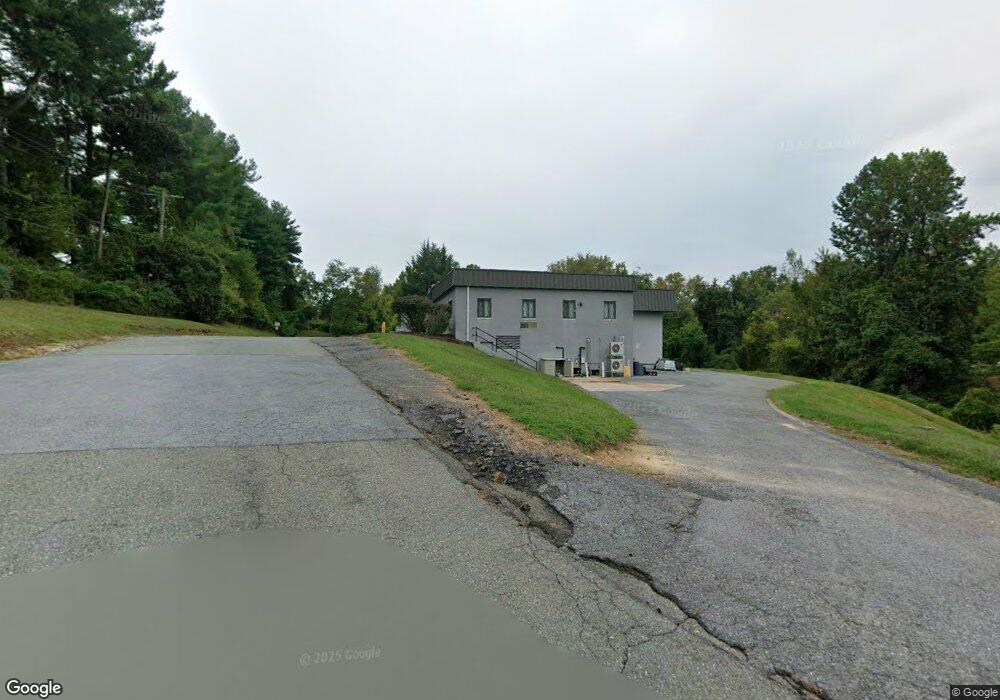
2601 Bel Pre Rd Silver Spring, MD 20906
Hermitage Park NeighborhoodEstimated Value: $10,550,973
Studio
--
Bath
25,602
Sq Ft
$412/Sq Ft
Est. Value
About This Home
This home is located at 2601 Bel Pre Rd, Silver Spring, MD 20906 and is currently estimated at $10,550,973, approximately $412 per square foot. 2601 Bel Pre Rd is a home located in Montgomery County with nearby schools including Bel Pre Elementary School, Strathmore Elementary School, and Argyle Middle School.
Ownership History
Date
Name
Owned For
Owner Type
Purchase Details
Closed on
Mar 17, 2016
Sold by
Maryland Nh Asset Llc
Bought by
Bpre Asset Ownership Llc
Current Estimated Value
Purchase Details
Closed on
Jun 6, 2008
Sold by
Thi Of Md Real Est Holding Co Llc
Bought by
Maryland Nh Asset Llc
Home Financials for this Owner
Home Financials are based on the most recent Mortgage that was taken out on this home.
Original Mortgage
$74,927
Interest Rate
5.99%
Mortgage Type
Commercial
Purchase Details
Closed on
Apr 18, 2008
Sold by
Thi Of Md Real Est Holding Co Llc
Bought by
Maryland Nh Asset Llc
Home Financials for this Owner
Home Financials are based on the most recent Mortgage that was taken out on this home.
Original Mortgage
$74,927
Interest Rate
5.99%
Mortgage Type
Commercial
Purchase Details
Closed on
Dec 4, 2002
Sold by
Millennium Holdings V Llc
Bought by
Thi Of Maryland Real Est and Holding Co Llc
Purchase Details
Closed on
Dec 30, 1999
Sold by
Care Medlantic Long Term
Bought by
Millennium Holdings V Llc
Create a Home Valuation Report for This Property
The Home Valuation Report is an in-depth analysis detailing your home's value as well as a comparison with similar homes in the area
Home Values in the Area
Average Home Value in this Area
Purchase History
| Date | Buyer | Sale Price | Title Company |
|---|---|---|---|
| Bpre Asset Ownership Llc | -- | Chicago Title Insurance Co | |
| Maryland Nh Asset Llc | $6,977,492 | -- | |
| Maryland Nh Asset Llc | $6,977,492 | -- | |
| Thi Of Maryland Real Est | $6,993,506 | -- | |
| Millennium Holdings V Llc | $3,000,000 | -- |
Source: Public Records
Mortgage History
| Date | Status | Borrower | Loan Amount |
|---|---|---|---|
| Previous Owner | Maryland Nh Asset Llc | $74,927 | |
| Previous Owner | Maryland Nh Asset Llc | $74,927 |
Source: Public Records
Tax History
| Year | Tax Paid | Tax Assessment Tax Assessment Total Assessment is a certain percentage of the fair market value that is determined by local assessors to be the total taxable value of land and additions on the property. | Land | Improvement |
|---|---|---|---|---|
| 2025 | $115,531 | $10,504,033 | -- | -- |
| 2024 | $115,531 | $9,722,900 | $4,208,800 | $5,514,100 |
| 2023 | $106,984 | $8,986,533 | $0 | $0 |
| 2022 | $94,484 | $8,250,167 | $0 | $0 |
| 2021 | $85,764 | $7,513,800 | $4,208,800 | $3,305,000 |
| 2020 | $85,764 | $7,513,800 | $4,208,800 | $3,305,000 |
| 2019 | $85,654 | $7,513,800 | $4,208,800 | $3,305,000 |
| 2018 | $86,379 | $7,565,800 | $4,008,000 | $3,557,800 |
| 2017 | $82,036 | $7,043,867 | $0 | $0 |
| 2016 | -- | $6,521,933 | $0 | $0 |
| 2015 | $75,585 | $6,000,000 | $0 | $0 |
| 2014 | $75,585 | $6,588,333 | $0 | $0 |
Source: Public Records
Map
Nearby Homes
- 14418 Bel Pre Dr
- 14410 Astrodome Dr
- 2727 Bel Pre Rd
- 2498 Sun Valley Cir
- 14400 Gunstock Ct
- 2360 Sun Valley Cir Unit 2
- 2346 Sun Valley Cir Unit 2-A
- 14209 Parker Farm Way
- 2202 Mears Ln
- 2428 White Horse Ln
- 14125 Parker Farm Way
- 2013 Sullivan Ln
- 3133 Beaverwood Ln
- 1815 Bonifant Rd
- 14028 Breeze Hill Ln
- 14908 Village Gate Dr
- 18 Catoctin Ct
- 2 Normandy Square Ct Unit D
- 5 Normandy Square Ct Unit 1-B
- 14905 Cleese Ct Unit 5AF
- 2621 Bel Pre Rd
- 14421 Big Bear Ct
- 2617 Bel Pre Rd
- 14419 Big Bear Ct
- 14419 Big Bear Ct Unit 200
- 14417 Big Bear Ct
- 14423 Big Bear Ct
- 2625 Bel Pre Rd
- 2425 Bel Pre Rd
- 2421 Bel Pre Rd
- 14415 Big Bear Ct
- 14217 Rippling Brook Dr
- 2600 Bel Pre Rd
- 14357 Bel Pre Dr
- 14418 Big Bear Ct
- 14361 Bel Pre Dr
- 14420 Big Bear Ct
- 14416 Big Bear Ct
- 14355 Bel Pre Dr
- 14325 Bel Pre Dr
Your Personal Tour Guide
Ask me questions while you tour the home.