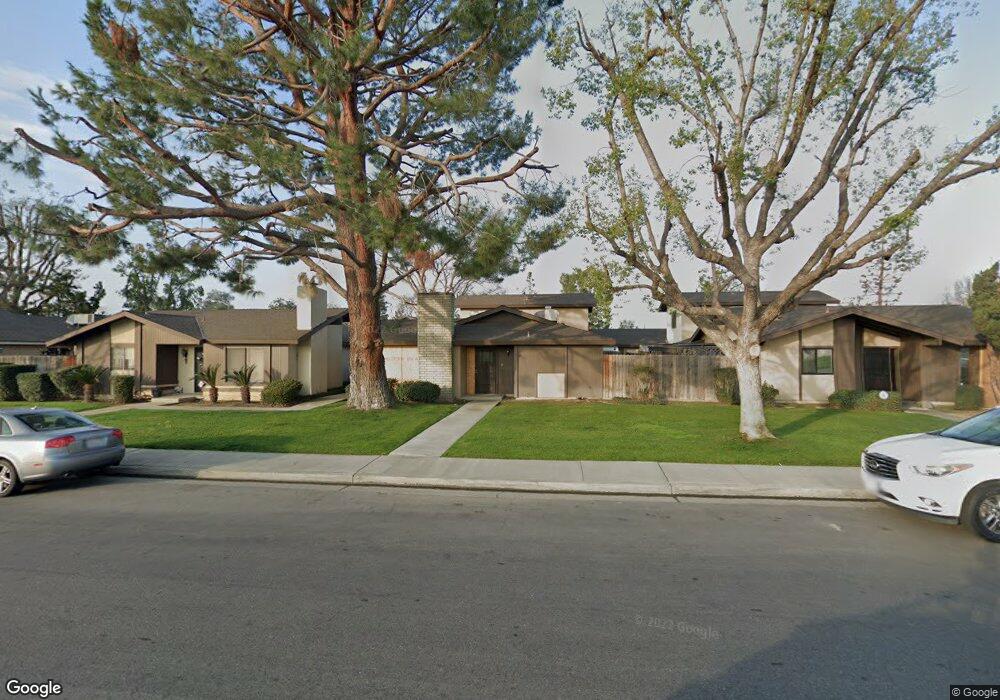
2601 Edmonton St Unit 12B Bakersfield, CA 93309
Southwest Bakersfield NeighborhoodEstimated Value: $170,000 - $174,000
2
Beds
1
Bath
792
Sq Ft
$217/Sq Ft
Est. Value
About This Home
This home is located at 2601 Edmonton St Unit 12B, Bakersfield, CA 93309 and is currently estimated at $171,542, approximately $216 per square foot. 2601 Edmonton St Unit 12B is a home located in Kern County with nearby schools including Stine Elementary School, Fred L. Thompson Junior High School, and West High School.
Ownership History
Date
Name
Owned For
Owner Type
Purchase Details
Closed on
May 16, 2024
Sold by
Church Family Trust and Church Norman K
Bought by
Mastro Matthew and Mastro Kelly
Current Estimated Value
Home Financials for this Owner
Home Financials are based on the most recent Mortgage that was taken out on this home.
Original Mortgage
$104,000
Outstanding Balance
$102,634
Interest Rate
7.22%
Mortgage Type
New Conventional
Estimated Equity
$68,908
Purchase Details
Closed on
Jan 16, 2009
Sold by
Church Norman K
Bought by
Church Norman K and The Church Family Trust
Purchase Details
Closed on
Jan 7, 2004
Sold by
Dayan David and Dayan Irene
Bought by
Dayan Joseph and Dayan Steve A
Purchase Details
Closed on
Dec 16, 2003
Sold by
Dayan Joseph and Dayan Steve Allen
Bought by
Church Norman K
Purchase Details
Closed on
May 22, 1995
Sold by
Dayan Wendy H
Bought by
Dayan Steve Allen
Purchase Details
Closed on
Feb 10, 1995
Sold by
Dayan Joseph and Dayan Sari
Bought by
Dayan Joseph
Create a Home Valuation Report for This Property
The Home Valuation Report is an in-depth analysis detailing your home's value as well as a comparison with similar homes in the area
Home Values in the Area
Average Home Value in this Area
Purchase History
| Date | Buyer | Sale Price | Title Company |
|---|---|---|---|
| Mastro Matthew | $160,000 | Lennar Title | |
| Church Norman K | -- | None Available | |
| Dayan Joseph | -- | Ticor Title | |
| Church Norman K | $42,000 | Ticor Title | |
| Dayan Steve Allen | -- | -- | |
| Dayan Joseph | -- | -- |
Source: Public Records
Mortgage History
| Date | Status | Borrower | Loan Amount |
|---|---|---|---|
| Open | Mastro Matthew | $104,000 |
Source: Public Records
Tax History Compared to Growth
Tax History
| Year | Tax Paid | Tax Assessment Tax Assessment Total Assessment is a certain percentage of the fair market value that is determined by local assessors to be the total taxable value of land and additions on the property. | Land | Improvement |
|---|---|---|---|---|
| 2025 | $1,354 | $163,200 | $51,000 | $112,200 |
| 2024 | $1,325 | $58,519 | $20,897 | $37,622 |
| 2023 | $1,325 | $57,373 | $20,488 | $36,885 |
| 2022 | $1,266 | $56,250 | $20,087 | $36,163 |
| 2021 | $1,170 | $55,149 | $19,694 | $35,455 |
| 2020 | $1,132 | $54,585 | $19,493 | $35,092 |
| 2019 | $1,115 | $54,585 | $19,493 | $35,092 |
| 2018 | $1,075 | $52,469 | $18,737 | $33,732 |
| 2017 | $1,042 | $51,441 | $18,370 | $33,071 |
| 2016 | $812 | $34,433 | $18,010 | $16,423 |
| 2015 | $979 | $49,676 | $17,740 | $31,936 |
| 2014 | $953 | $48,704 | $17,393 | $31,311 |
Source: Public Records
Map
Nearby Homes
- 2600 Layton Dr
- 5009 Stormy Ct
- 4517 Meadowlark Way
- 4608 Posada Ave
- 4701 Misty Ct
- 2808 Edmonton St
- 2304 Bladen St
- 2415 Bladen St
- 2213 Sandpiper Rd
- 4408 Flicker Dr
- 5005 Surrey Ln
- 2209 Westminster Dr
- 5001 Appleblossom Dr
- 2504 Prestwick Ct
- 5116 Sherman Ave
- 2109 Oriole St
- 3104 Summer Side Ct
- 2608 Hallisey St
- 5611 Wilson Rd
- 5512 Appletree Ln
- 2601 Edmonton St
- 2601 Edmonton St Unit 12A
- 2601 Edmonton St Unit 11A
- 2601 Edmonton St Unit 11B
- 2601 Edmonton St Unit 10B
- 2601 Edmonton St Unit 10A
- 2601 Edmonton St Unit 9A
- 2601 Edmonton St Unit 9B
- 2601 Edmonton St Unit 8A
- 2601 Edmonton St Unit 8B
- 2601 Edmonton St Unit 1A
- 2601 Edmonton St Unit 1B
- 2601 Edmonton St Unit 2B
- 2601 Edmonton St Unit 2A
- 2601 Edmonton St Unit 3A
- 2601 Edmonton St Unit 3B
- 2601 Edmonton St Unit 4B
- 2601 Edmonton St Unit 4A
- 2601 Edmonton St Unit 5A
- 2601 Edmonton St Unit 5B