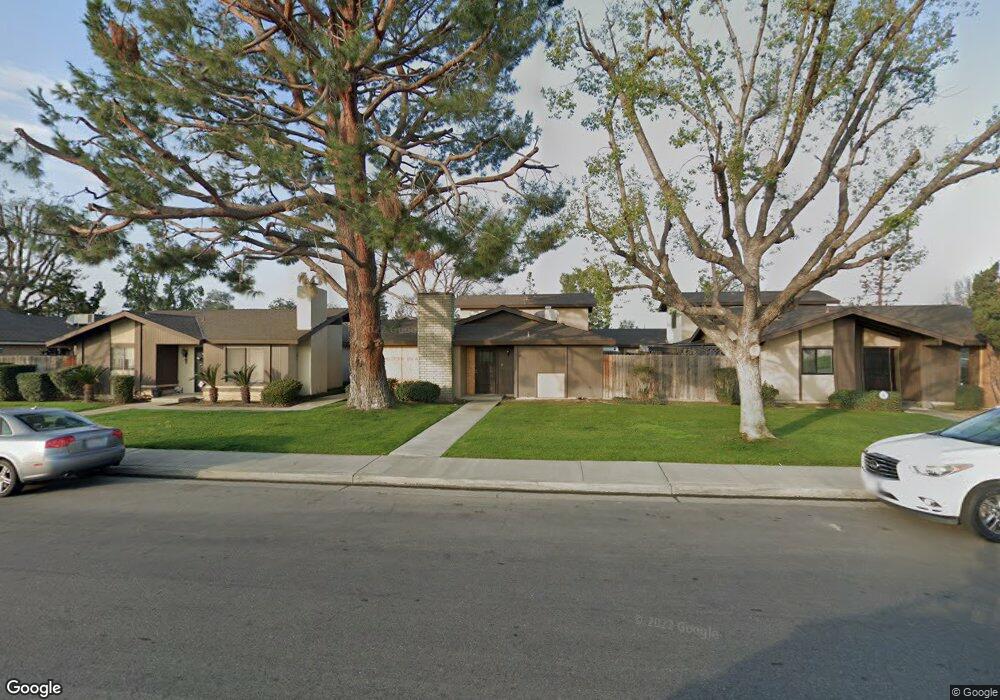
2601 Edmonton St Unit 5B Bakersfield, CA 93309
Southwest Bakersfield NeighborhoodEstimated Value: $138,186 - $168,000
2
Beds
2
Baths
506
Sq Ft
$303/Sq Ft
Est. Value
About This Home
This home is located at 2601 Edmonton St Unit 5B, Bakersfield, CA 93309 and is currently estimated at $153,093, approximately $302 per square foot. 2601 Edmonton St Unit 5B is a home located in Kern County with nearby schools including Stine Elementary School, Fred L. Thompson Junior High School, and West High School.
Ownership History
Date
Name
Owned For
Owner Type
Purchase Details
Closed on
Mar 19, 2021
Sold by
Garcia Oscar and Vazquez Veronica
Bought by
Garcia Oscar
Current Estimated Value
Home Financials for this Owner
Home Financials are based on the most recent Mortgage that was taken out on this home.
Original Mortgage
$59,000
Outstanding Balance
$52,916
Interest Rate
2.73%
Mortgage Type
New Conventional
Estimated Equity
$100,177
Purchase Details
Closed on
Jun 14, 2017
Sold by
Harper Mark Louis and Walter W Harper Family Trust
Bought by
Garcia Oscar and Vazquez Veronica
Home Financials for this Owner
Home Financials are based on the most recent Mortgage that was taken out on this home.
Original Mortgage
$61,600
Interest Rate
3.95%
Mortgage Type
New Conventional
Purchase Details
Closed on
Apr 10, 2007
Sold by
Harper Walter W
Bought by
Harper Walter W and The Walter W Harper Family Tru
Purchase Details
Closed on
Apr 11, 2001
Sold by
Harper Stanley Wells
Bought by
Harper Walter W
Create a Home Valuation Report for This Property
The Home Valuation Report is an in-depth analysis detailing your home's value as well as a comparison with similar homes in the area
Home Values in the Area
Average Home Value in this Area
Purchase History
| Date | Buyer | Sale Price | Title Company |
|---|---|---|---|
| Garcia Oscar | $29,500 | Lennar Title Inc | |
| Garcia Oscar | $77,000 | Placer Title Company | |
| Harper Walter W | -- | None Available | |
| Harper Walter W | $30,000 | Chicago Title Co |
Source: Public Records
Mortgage History
| Date | Status | Borrower | Loan Amount |
|---|---|---|---|
| Open | Garcia Oscar | $59,000 | |
| Previous Owner | Garcia Oscar | $61,600 |
Source: Public Records
Tax History
| Year | Tax Paid | Tax Assessment Tax Assessment Total Assessment is a certain percentage of the fair market value that is determined by local assessors to be the total taxable value of land and additions on the property. | Land | Improvement |
|---|---|---|---|---|
| 2025 | $1,706 | $89,359 | $23,209 | $66,150 |
| 2024 | $1,674 | $87,607 | $22,754 | $64,853 |
| 2023 | $1,674 | $85,890 | $22,308 | $63,582 |
| 2022 | $1,602 | $84,207 | $21,871 | $62,336 |
| 2021 | $1,502 | $82,557 | $21,443 | $61,114 |
| 2020 | $1,461 | $81,712 | $21,224 | $60,488 |
| 2019 | $1,441 | $81,712 | $21,224 | $60,488 |
| 2018 | $1,384 | $78,540 | $20,400 | $58,140 |
| 2017 | $898 | $39,312 | $13,233 | $26,079 |
| 2016 | $858 | $38,542 | $12,974 | $25,568 |
| 2015 | $846 | $37,964 | $12,780 | $25,184 |
| 2014 | $824 | $37,221 | $12,530 | $24,691 |
Source: Public Records
Map
Nearby Homes
- 2418 Hasti Acres Dr
- 4608 Posada Ave
- 4704 Winners Cir
- 2316 Sandpiper Rd
- 2808 Edmonton St
- 4507 Posada Ave
- 2416 Bladen St
- 2304 Bladen St
- 2415 Bladen St
- 5005 Surrey Ln
- 4007 Phaffle Dr
- 3109 Edmonton St
- 5001 Appleblossom Dr
- 2209 Westminster Dr
- 2021 Carlton St
- 3104 Summer Side Ct
- 4713 Summertree Ln
- 2608 Hallisey St
- 2508 Prestwick Ct
- 2304 San Marino Dr
- 2601 Edmonton St
- 2601 Edmonton St Unit 12B
- 2601 Edmonton St Unit 12A
- 2601 Edmonton St Unit 11A
- 2601 Edmonton St Unit 11B
- 2601 Edmonton St Unit 10B
- 2601 Edmonton St Unit 10A
- 2601 Edmonton St Unit 9A
- 2601 Edmonton St Unit 9B
- 2601 Edmonton St Unit 8A
- 2601 Edmonton St Unit 8B
- 2601 Edmonton St Unit 1A
- 2601 Edmonton St Unit 1B
- 2601 Edmonton St Unit 2B
- 2601 Edmonton St Unit 2A
- 2601 Edmonton St Unit 3A
- 2601 Edmonton St Unit 3B
- 2601 Edmonton St Unit 4B
- 2601 Edmonton St Unit 4A
- 2601 Edmonton St Unit 5A
Your Personal Tour Guide
Ask me questions while you tour the home.