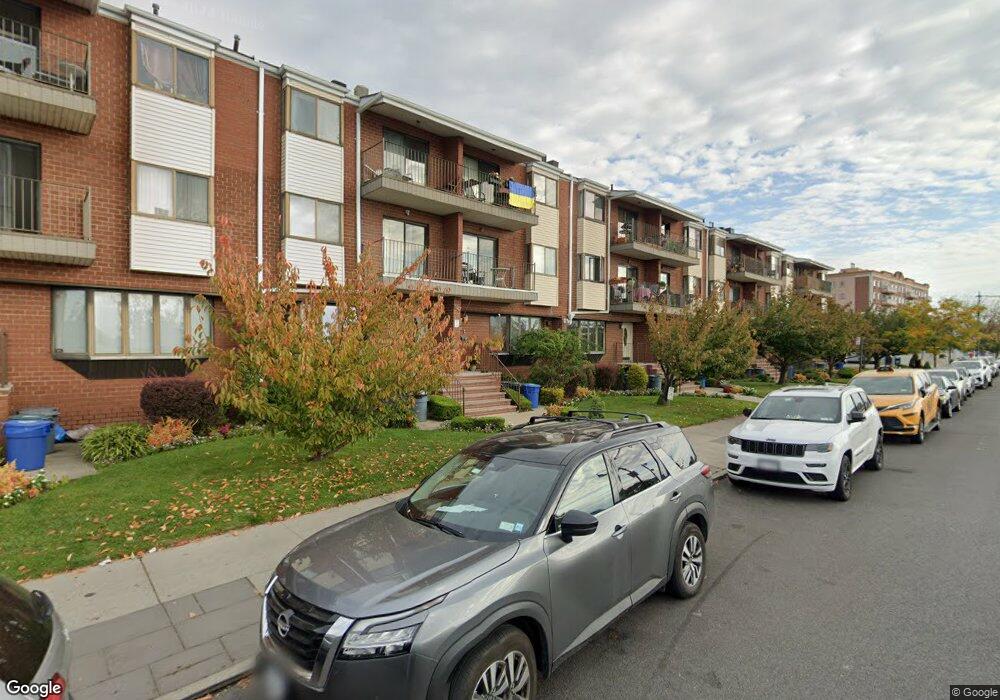
2601 Emmons Ave Unit 2629 Brooklyn, NY 11235
Sheepshead Bay NeighborhoodEstimated Value: $316,000 - $416,000
--
Bed
--
Bath
561
Sq Ft
$658/Sq Ft
Est. Value
About This Home
This home is located at 2601 Emmons Ave Unit 2629, Brooklyn, NY 11235 and is currently estimated at $369,142, approximately $658 per square foot. 2601 Emmons Ave Unit 2629 is a home located in Kings County with nearby schools including P.S. 52 Sheepshead Bay, Jhs 14 Shell Bank, and St Mark School.
Ownership History
Date
Name
Owned For
Owner Type
Purchase Details
Closed on
Dec 4, 2023
Sold by
Kostanian Karen
Bought by
Balber Aleksandr
Current Estimated Value
Purchase Details
Closed on
Jul 29, 2004
Sold by
Shleyger Liliya
Bought by
Kostanian Karen
Home Financials for this Owner
Home Financials are based on the most recent Mortgage that was taken out on this home.
Original Mortgage
$210,400
Interest Rate
6.16%
Mortgage Type
Purchase Money Mortgage
Purchase Details
Closed on
Feb 9, 2004
Sold by
Karp Gary and Needell Cheryl
Bought by
Shleyger Liliya
Home Financials for this Owner
Home Financials are based on the most recent Mortgage that was taken out on this home.
Original Mortgage
$150,500
Interest Rate
5.83%
Mortgage Type
Purchase Money Mortgage
Create a Home Valuation Report for This Property
The Home Valuation Report is an in-depth analysis detailing your home's value as well as a comparison with similar homes in the area
Home Values in the Area
Average Home Value in this Area
Purchase History
| Date | Buyer | Sale Price | Title Company |
|---|---|---|---|
| Balber Aleksandr | $280,000 | -- | |
| Kostanian Karen | $263,000 | -- | |
| Kostanian Karen | $263,000 | -- | |
| Shleyger Liliya | $215,000 | -- | |
| Shleyger Liliya | $215,000 | -- |
Source: Public Records
Mortgage History
| Date | Status | Borrower | Loan Amount |
|---|---|---|---|
| Previous Owner | Kostanian Karen | $26,300 | |
| Previous Owner | Kostanian Karen | $210,400 | |
| Previous Owner | Shleyger Liliya | $21,000 | |
| Previous Owner | Shleyger Liliya | $150,500 |
Source: Public Records
Tax History Compared to Growth
Tax History
| Year | Tax Paid | Tax Assessment Tax Assessment Total Assessment is a certain percentage of the fair market value that is determined by local assessors to be the total taxable value of land and additions on the property. | Land | Improvement |
|---|---|---|---|---|
| 2025 | $2,748 | $20,514 | $1,443 | $19,071 |
| 2024 | $2,748 | $18,490 | $1,443 | $17,047 |
| 2023 | $2,674 | $21,903 | $1,443 | $20,460 |
| 2022 | $2,479 | $20,167 | $1,443 | $18,724 |
| 2021 | $2,466 | $17,821 | $1,443 | $16,378 |
| 2020 | $1,193 | $19,519 | $1,443 | $18,076 |
| 2019 | $2,385 | $20,565 | $1,443 | $19,122 |
| 2018 | $2,236 | $10,971 | $801 | $10,170 |
| 2017 | $2,110 | $10,350 | $817 | $9,533 |
| 2016 | $1,952 | $9,765 | $835 | $8,930 |
| 2015 | $785 | $9,463 | $811 | $8,652 |
| 2014 | $785 | $14,230 | $1,195 | $13,035 |
Source: Public Records
Map
Nearby Homes
- 2613 Emmons Ave Unit 3D
- 4817 Bedford Ave Unit 3A
- 4812 Bedford Ave Unit 1A
- 2809 E 28th St Unit 1C
- 2758 E 26th St
- 3611 Shore Pkwy Unit 1C
- 2752 E 27th St Unit A3
- 2800 E 29th St Unit 103
- 2900 E 29th St Unit 2E
- 2726 E 27th St
- 3678 Shore Pkwy
- 4078 Nostrand Ave Unit 1B
- 4050 Nostrand Ave Unit 1F
- 2711 E 26th St
- 3655 Shore Pkwy Unit 2J
- 2614 Voorhies Ave
- 4715 Bedford Ave
- 2717 E 28th St Unit 4E
- 4709 Bedford Ave
- 2330 Voorhies Ave Unit LC
- 2601 Emmons Ave Unit 2629
- 2601 Emmons Ave Unit 2629
- 2601 Emmons Ave Unit 2629
- 2601 Emmons Ave Unit 2629
- 2601 Emmons Ave Unit 2629
- 2601 Emmons Ave Unit 2629
- 2601 Emmons Ave Unit 2629
- 2601 Emmons Ave Unit 2629
- 2601 Emmons Ave Unit 2629
- 2601 Emmons Ave Unit 2629
- 2601 Emmons Ave Unit 2629
- 2601 Emmons Ave Unit 2629
- 2601 Emmons Ave Unit 2629
- 2601 Emmons Ave Unit 2629
- 2601 Emmons Ave Unit 2629
- 2601 Emmons Ave Unit 2629
- 2601 Emmons Ave Unit 2629
- 2601 Emmons Ave Unit 2629
- 2601 Emmons Ave Unit 2629
- 2601 Emmons Ave Unit 2629