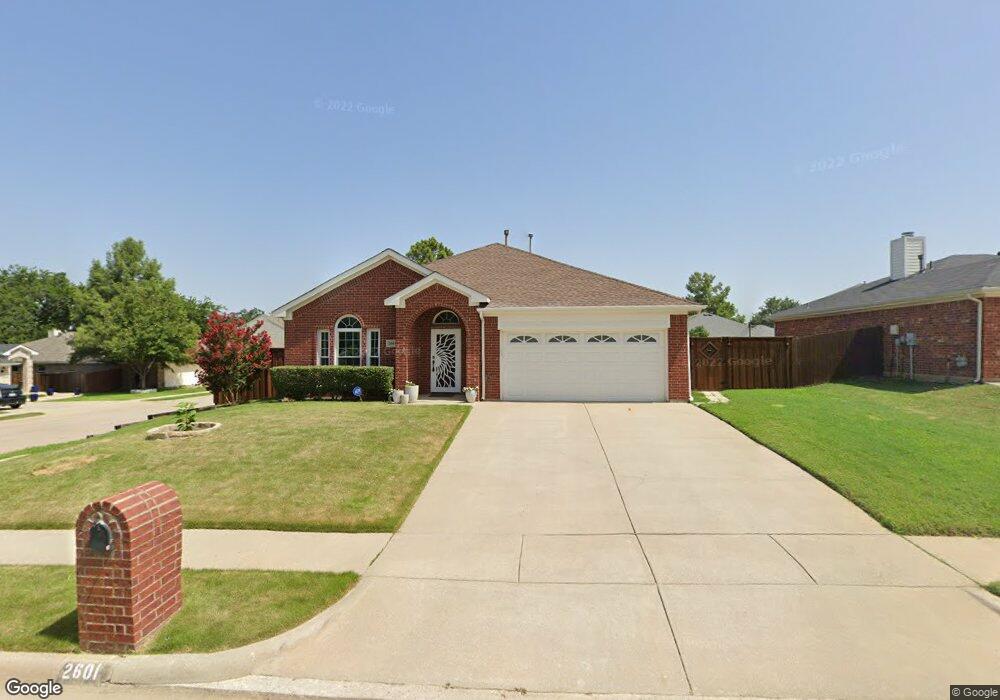
2601 Hilcroft Ave Denton, TX 76210
South Denton NeighborhoodEstimated Value: $358,000 - $385,000
4
Beds
2
Baths
1,966
Sq Ft
$190/Sq Ft
Est. Value
About This Home
This home is located at 2601 Hilcroft Ave, Denton, TX 76210 and is currently estimated at $373,313, approximately $189 per square foot. 2601 Hilcroft Ave is a home located in Denton County with nearby schools including Nelson Elementary School, McMath Middle School, and Denton High School.
Ownership History
Date
Name
Owned For
Owner Type
Purchase Details
Closed on
Jul 17, 2015
Sold by
Begaj Hartest and Begaj Greta
Bought by
Widdison Marie and Widdison Family Trust
Current Estimated Value
Purchase Details
Closed on
Jul 13, 2006
Sold by
Hud
Bought by
Begaj Hartest and Begaj Greta
Home Financials for this Owner
Home Financials are based on the most recent Mortgage that was taken out on this home.
Original Mortgage
$104,400
Interest Rate
6.67%
Mortgage Type
Purchase Money Mortgage
Purchase Details
Closed on
Feb 20, 2006
Sold by
Wells Fargo Bank Na
Bought by
Hud
Purchase Details
Closed on
Feb 7, 2006
Sold by
Phillis Kenney and Phillis Marilyn
Bought by
Wells Fargo Bank Na
Purchase Details
Closed on
May 13, 2002
Sold by
Choice Home Inc
Bought by
Phillis Kenney
Home Financials for this Owner
Home Financials are based on the most recent Mortgage that was taken out on this home.
Original Mortgage
$144,487
Interest Rate
7.1%
Mortgage Type
FHA
Create a Home Valuation Report for This Property
The Home Valuation Report is an in-depth analysis detailing your home's value as well as a comparison with similar homes in the area
Home Values in the Area
Average Home Value in this Area
Purchase History
| Date | Buyer | Sale Price | Title Company |
|---|---|---|---|
| Widdison Marie | -- | Stewart | |
| Begaj Hartest | $130,500 | None Available | |
| Hud | -- | None Available | |
| Wells Fargo Bank Na | $173,584 | None Available | |
| Phillis Kenney | -- | -- |
Source: Public Records
Mortgage History
| Date | Status | Borrower | Loan Amount |
|---|---|---|---|
| Previous Owner | Begaj Hartest | $104,400 | |
| Previous Owner | Phillis Kenney | $144,487 |
Source: Public Records
Tax History Compared to Growth
Tax History
| Year | Tax Paid | Tax Assessment Tax Assessment Total Assessment is a certain percentage of the fair market value that is determined by local assessors to be the total taxable value of land and additions on the property. | Land | Improvement |
|---|---|---|---|---|
| 2025 | $1,861 | $349,849 | $82,703 | $267,146 |
| 2024 | $6,702 | $347,238 | $0 | $0 |
| 2023 | $1,866 | $315,671 | $82,703 | $276,662 |
| 2022 | $6,092 | $286,974 | $65,208 | $221,766 |
| 2021 | $5,859 | $269,069 | $44,533 | $224,536 |
| 2020 | $5,477 | $239,613 | $44,533 | $195,080 |
| 2019 | $5,512 | $231,000 | $44,533 | $189,467 |
| 2018 | $5,073 | $210,000 | $44,533 | $165,467 |
| 2017 | $4,746 | $192,000 | $38,171 | $153,829 |
| 2016 | $3,510 | $185,000 | $38,171 | $146,829 |
| 2015 | $3,527 | $166,734 | $38,171 | $130,514 |
| 2014 | $3,527 | $151,576 | $38,171 | $119,171 |
| 2013 | -- | $137,796 | $38,171 | $99,625 |
Source: Public Records
Map
Nearby Homes
- 2616 Hilcroft Ave
- 2617 Bissonet Dr
- 2617 Hollow Ridge Dr
- 2713 Hilcroft Ave
- 2617 Hereford Rd
- 2804 Hollow Ridge Dr
- 2601 Pinto Dr
- 2721 Arabian Ave
- 3900 Gessner Dr
- 2817 Hereford Rd
- 2713 Clubhouse Dr
- 3448 Tuscan Hills Cir
- 2121 Corsair Ln
- 3428 Tuscan Hills Cir
- 3432 Sundown Blvd
- 3812 Gennaker Dr
- 3000 Bella Lago Dr
- 2600 Pioneer Dr
- 2508 Pioneer Dr
- 2008 Moonsail Ln
- 2605 Hilcroft Ave
- 2600 Weslayan Dr
- 2609 Hilcroft Ave
- 2604 Weslayan Dr
- 3712 Dunlavy Rd
- 3716 Dunlavy Rd
- 2600 Hilcroft Ave
- 3708 Dunlavy Rd
- 2608 Weslayan Dr
- 2604 Hilcroft Ave
- 3720 Dunlavy Rd
- 2613 Hilcroft Ave
- 3704 Dunlavy Rd
- 2608 Hilcroft Ave
- 2612 Weslayan Dr
- 3724 Dunlavy Rd
- 2612 Hilcroft Ave
- 2617 Hilcroft Ave
- 3700 Dunlavy Rd
- 3721 Ranchman Blvd