Estimated Value: $239,323 - $310,000
3
Beds
2
Baths
1,124
Sq Ft
$251/Sq Ft
Est. Value
About This Home
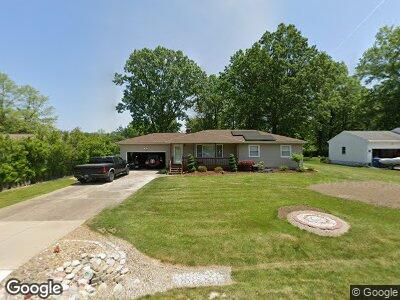
This home is located at 2601 Joseph St, Avon, OH 44011 and is currently estimated at $282,081, approximately $250 per square foot. 2601 Joseph St is a home located in Lorain County with nearby schools including Avon East Elementary School, Avon Heritage South Elementary School, and Avon Middle School.
Ownership History
Date
Name
Owned For
Owner Type
Purchase Details
Closed on
Jan 16, 2003
Sold by
Christopher Charles G
Bought by
Christopher Laurie A
Current Estimated Value
Home Financials for this Owner
Home Financials are based on the most recent Mortgage that was taken out on this home.
Original Mortgage
$122,400
Interest Rate
5.4%
Mortgage Type
Unknown
Purchase Details
Closed on
May 14, 2001
Sold by
Staff Joseph R and Staff Angela D
Bought by
Macejko Anthony J and Christopher Laurie A
Home Financials for this Owner
Home Financials are based on the most recent Mortgage that was taken out on this home.
Original Mortgage
$116,750
Interest Rate
6.99%
Purchase Details
Closed on
Sep 24, 1998
Sold by
Mclaughlin Russell T
Bought by
Staff Joseph R and Staff Angela D
Home Financials for this Owner
Home Financials are based on the most recent Mortgage that was taken out on this home.
Original Mortgage
$94,000
Interest Rate
6.99%
Create a Home Valuation Report for This Property
The Home Valuation Report is an in-depth analysis detailing your home's value as well as a comparison with similar homes in the area
Home Values in the Area
Average Home Value in this Area
Purchase History
| Date | Buyer | Sale Price | Title Company |
|---|---|---|---|
| Christopher Laurie A | -- | -- | |
| Macejko Anthony J | $123,000 | Insignia Title Agency Ltd | |
| Staff Joseph R | $114,000 | -- |
Source: Public Records
Mortgage History
| Date | Status | Borrower | Loan Amount |
|---|---|---|---|
| Closed | Macejko Anthony J | $83,500 | |
| Closed | Macejko Anthony J | $30,000 | |
| Closed | Macejko Anthony J | $26,700 | |
| Closed | Christopher Laurie A | $19,000 | |
| Closed | Macejko Anthony J | $122,400 | |
| Closed | Macejko Anthony J | $30,600 | |
| Closed | Macejko Anthony J | $120,000 | |
| Closed | Macejko Anthony J | $116,750 | |
| Closed | Staff Joseph R | $94,000 |
Source: Public Records
Tax History Compared to Growth
Tax History
| Year | Tax Paid | Tax Assessment Tax Assessment Total Assessment is a certain percentage of the fair market value that is determined by local assessors to be the total taxable value of land and additions on the property. | Land | Improvement |
|---|---|---|---|---|
| 2024 | $3,576 | $71,096 | $22,299 | $48,797 |
| 2023 | $3,025 | $53,456 | $16,744 | $36,712 |
| 2022 | $2,997 | $53,456 | $16,744 | $36,712 |
| 2021 | $3,003 | $53,456 | $16,744 | $36,712 |
| 2020 | $2,648 | $44,220 | $13,850 | $30,370 |
| 2019 | $2,596 | $44,220 | $13,850 | $30,370 |
| 2018 | $2,471 | $44,220 | $13,850 | $30,370 |
| 2017 | $2,532 | $43,280 | $12,350 | $30,930 |
| 2016 | $2,562 | $43,280 | $12,350 | $30,930 |
| 2015 | $2,588 | $43,280 | $12,350 | $30,930 |
| 2014 | $2,337 | $39,350 | $11,230 | $28,120 |
| 2013 | $2,349 | $39,350 | $11,230 | $28,120 |
Source: Public Records
Map
Nearby Homes
- 2735 Elizabeth St
- 2152 Vivian Way
- 35150 Emory Dr
- 2115 Vivian Way
- 35146 Saddle Creek
- 3181 Jaycox Rd
- 2227 Langford Ln
- 3195 Napa Blvd
- 35317 Emory Dr
- 2201 Langford Ln Unit 105
- 2174 Southampton Ln
- 2461 Seton Dr
- 3135 Woodstone Ln
- 0 Detroit Rd Unit 5098540
- 0 Detroit Rd Unit 5090789
- 3241 Woodstone Ln Unit 3
- 3268 Woodstone Ln
- 1912 Pembrooke Ln
- 3402 Mass Dr
- 3672 Williams Ct
- 2601 Joseph St
- 2615 Joseph St
- 2585 Joseph St
- 2600 Joseph St
- 2584 Joseph St
- 2616 Joseph St
- 2643 Joseph St
- 2566 Joseph St
- 2630 Joseph St
- 2551 Joseph St
- 2550 Joseph St
- 2644 Joseph St
- 2661 Joseph St
- 2533 Joseph St
- 2532 Joseph St
- 2660 Joseph St
- 2675 Joseph St
- 34175 Detroit Rd
- 34171 Detroit Rd
- 2674 Joseph St