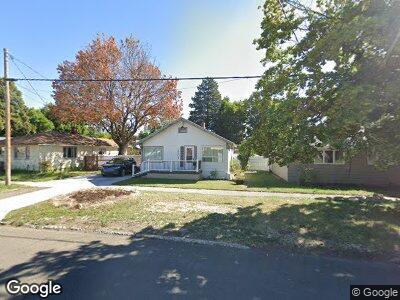
2601 N Ash St La Grande, OR 97850
Estimated Value: $207,958 - $230,000
2
Beds
1
Bath
1,138
Sq Ft
$192/Sq Ft
Est. Value
About This Home
This home is located at 2601 N Ash St, La Grande, OR 97850 and is currently estimated at $218,979, approximately $192 per square foot. 2601 N Ash St is a home located in Union County with nearby schools including La Grande High School, The Marian Academy, and Grande Ronde Academy.
Ownership History
Date
Name
Owned For
Owner Type
Purchase Details
Closed on
May 23, 2022
Sold by
Hyman Lewis A
Bought by
Brook Susan M
Current Estimated Value
Purchase Details
Closed on
May 11, 2012
Sold by
Mcconnell Deborah K and Adams Kimberly
Bought by
Church Robin A
Create a Home Valuation Report for This Property
The Home Valuation Report is an in-depth analysis detailing your home's value as well as a comparison with similar homes in the area
Home Values in the Area
Average Home Value in this Area
Purchase History
| Date | Buyer | Sale Price | Title Company |
|---|---|---|---|
| Brook Susan M | -- | None Listed On Document | |
| Church Robin A | $65,000 | Eastern Oregon Title Inc | |
| Church Robin A | $65,000 | None Available |
Source: Public Records
Mortgage History
| Date | Status | Borrower | Loan Amount |
|---|---|---|---|
| Previous Owner | Church Robin A | $36,500 | |
| Previous Owner | Church Robin A | $76,000 | |
| Previous Owner | Church Robin A | $14,000 | |
| Previous Owner | Church Robin A | $55,000 | |
| Previous Owner | Church Robin A | $20,000 |
Source: Public Records
Tax History Compared to Growth
Tax History
| Year | Tax Paid | Tax Assessment Tax Assessment Total Assessment is a certain percentage of the fair market value that is determined by local assessors to be the total taxable value of land and additions on the property. | Land | Improvement |
|---|---|---|---|---|
| 2024 | $1,797 | $99,840 | $31,850 | $67,990 |
| 2023 | $1,766 | $96,940 | $30,920 | $66,020 |
| 2022 | $1,719 | $94,123 | $30,018 | $64,105 |
| 2021 | $1,675 | $91,382 | $29,589 | $61,793 |
| 2020 | $1,608 | $88,721 | $28,750 | $59,971 |
| 2019 | $1,574 | $86,137 | $28,115 | $58,022 |
| 2018 | $1,533 | $83,629 | $27,555 | $56,074 |
| 2017 | $1,489 | $81,194 | $25,647 | $55,547 |
| 2016 | $1,395 | $78,830 | $24,967 | $53,863 |
| 2015 | $1,305 | $76,534 | $24,141 | $52,393 |
| 2014 | $1,195 | $74,305 | $23,583 | $50,722 |
| 2013 | -- | $72,141 | $23,023 | $49,118 |
Source: Public Records
Map
Nearby Homes