2601 S Lowe Ave Unit C Chicago, IL 60616
Bridgeport NeighborhoodEstimated Value: $373,000 - $495,000
3
Beds
2
Baths
1,320
Sq Ft
$326/Sq Ft
Est. Value
About This Home
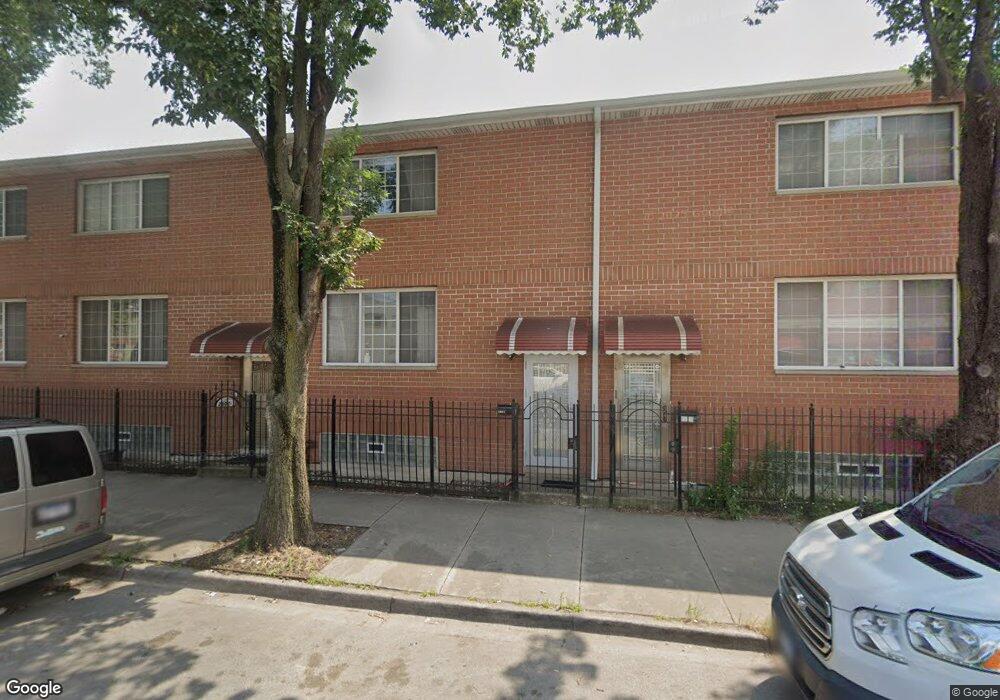
This home is located at 2601 S Lowe Ave Unit C, Chicago, IL 60616 and is currently estimated at $430,439, approximately $326 per square foot. 2601 S Lowe Ave Unit C is a home located in Cook County with nearby schools including Healy Elementary School, St. Jerome Catholic School, and St Therese School.
Ownership History
Date
Name
Owned For
Owner Type
Purchase Details
Closed on
Mar 11, 2025
Sold by
Li Tingjun
Bought by
Li Tingjun and Ruan Yanna
Current Estimated Value
Purchase Details
Closed on
Nov 3, 2017
Sold by
Lee Steve and Lee Dai Hao Yuan
Bought by
Li Ting Jun
Home Financials for this Owner
Home Financials are based on the most recent Mortgage that was taken out on this home.
Original Mortgage
$195,000
Interest Rate
4.12%
Mortgage Type
Adjustable Rate Mortgage/ARM
Purchase Details
Closed on
Nov 14, 2000
Sold by
Lakeside Bank
Bought by
Lee Steve and Lee Dai Hao Yuan
Home Financials for this Owner
Home Financials are based on the most recent Mortgage that was taken out on this home.
Original Mortgage
$65,000
Interest Rate
7.03%
Create a Home Valuation Report for This Property
The Home Valuation Report is an in-depth analysis detailing your home's value as well as a comparison with similar homes in the area
Home Values in the Area
Average Home Value in this Area
Purchase History
| Date | Buyer | Sale Price | Title Company |
|---|---|---|---|
| Li Tingjun | -- | None Listed On Document | |
| Li Ting Jun | $331,000 | Chicago Title Insurance Comp | |
| Lee Steve | $165,000 | -- |
Source: Public Records
Mortgage History
| Date | Status | Borrower | Loan Amount |
|---|---|---|---|
| Previous Owner | Li Ting Jun | $195,000 | |
| Previous Owner | Lee Steve | $65,000 |
Source: Public Records
Tax History Compared to Growth
Tax History
| Year | Tax Paid | Tax Assessment Tax Assessment Total Assessment is a certain percentage of the fair market value that is determined by local assessors to be the total taxable value of land and additions on the property. | Land | Improvement |
|---|---|---|---|---|
| 2024 | $7,384 | $37,001 | $5,238 | $31,763 |
| 2023 | $7,199 | $35,000 | $4,228 | $30,772 |
| 2022 | $7,199 | $35,000 | $4,228 | $30,772 |
| 2021 | $7,038 | $34,999 | $4,228 | $30,771 |
| 2020 | $6,628 | $29,755 | $4,228 | $25,527 |
| 2019 | $6,717 | $33,433 | $4,228 | $29,205 |
| 2018 | $6,604 | $33,433 | $4,228 | $29,205 |
| 2017 | $6,237 | $32,348 | $3,363 | $28,985 |
| 2016 | $5,979 | $32,348 | $3,363 | $28,985 |
| 2015 | $5,447 | $32,348 | $3,363 | $28,985 |
| 2014 | $4,452 | $26,564 | $2,883 | $23,681 |
| 2013 | $4,353 | $26,564 | $2,883 | $23,681 |
Source: Public Records
Map
Nearby Homes
- 2612 S Lowe Ave
- 2543 S Wallace St Unit 11
- 511 W 25th Place
- 2628 S Union Ave
- 2567 S Emerald Ave
- 459 W 26th St
- 3255 S Canal St
- 2807 S Halsted St Unit 201
- 2807 S Halsted St Unit 205
- 2807 S Halsted St Unit 204
- 2828 S Emerald Ave
- 2849 S Normal Ave
- 2906 S Lowe Ave
- 475 W 24th St Unit 2A
- 310 W 24th Place
- 450 W 29th St
- 2929 S Wallace St
- 349 W 26th St
- 2958 S Lowe Ave
- 2631 S Shields Ave
- 2601 S Lowe Ave
- 2601 S Lowe Ave
- 2601 S Lowe Ave
- 2601 S Lowe Ave
- 2601 S Lowe Ave
- 2601 S Lowe Ave
- 2605 S Lowe Ave Unit 3
- 2605 S Lowe Ave Unit 2
- 2605 S Lowe Ave Unit 1
- 2607 S Lowe Ave
- 2609 S Lowe Ave
- 612 W 26th St
- 612 W 26th St Unit 2F
- 2604 S Wallace St
- 2602 S Wallace St
- 2600 S Wallace St
- 2606 S Wallace St
- 2610 S Wallace St
- 620 W 26th St Unit 2
- 620 W 26th St