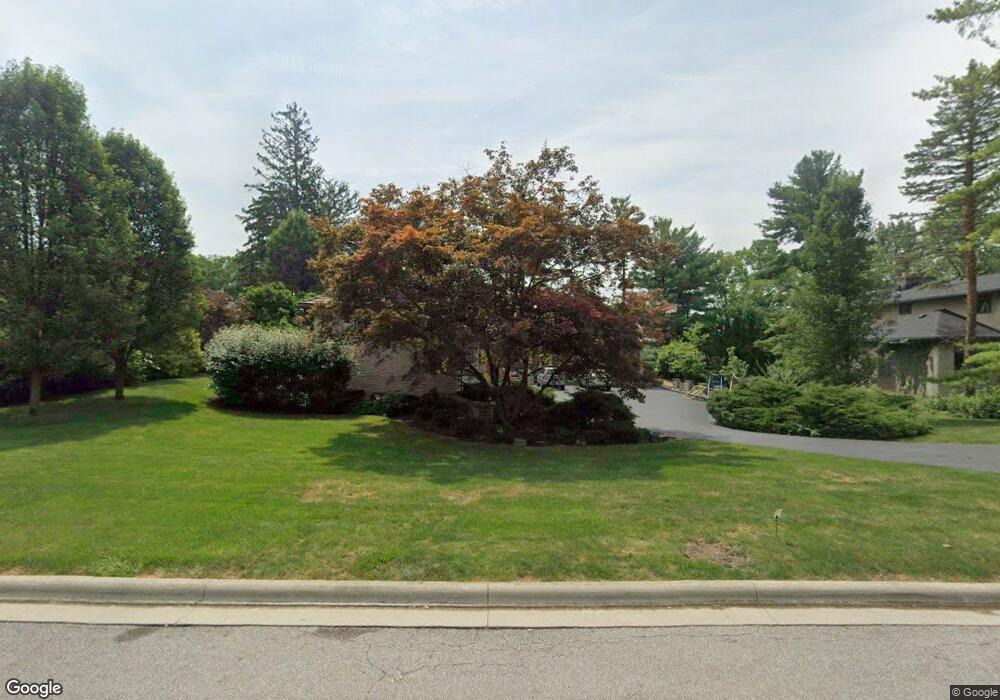
2601 Sherwin Rd Columbus, OH 43221
Estimated Value: $2,131,000 - $3,205,000
6
Beds
7
Baths
9,700
Sq Ft
$269/Sq Ft
Est. Value
About This Home
This home is located at 2601 Sherwin Rd, Columbus, OH 43221 and is currently estimated at $2,610,696, approximately $269 per square foot. 2601 Sherwin Rd is a home located in Franklin County with nearby schools including Tremont Elementary School, Jones Middle School, and Upper Arlington High School.
Ownership History
Date
Name
Owned For
Owner Type
Purchase Details
Closed on
Oct 26, 2007
Sold by
Capital Trading Co
Bought by
Kirsner John M and Han Lisa Ge Shang
Current Estimated Value
Home Financials for this Owner
Home Financials are based on the most recent Mortgage that was taken out on this home.
Original Mortgage
$463,000
Outstanding Balance
$288,482
Interest Rate
6.44%
Mortgage Type
Credit Line Revolving
Estimated Equity
$2,322,214
Purchase Details
Closed on
Sep 4, 2007
Sold by
Evans Ruth Ann and Evans William
Bought by
Capital Trading Co
Home Financials for this Owner
Home Financials are based on the most recent Mortgage that was taken out on this home.
Original Mortgage
$463,000
Outstanding Balance
$288,482
Interest Rate
6.44%
Mortgage Type
Credit Line Revolving
Estimated Equity
$2,322,214
Purchase Details
Closed on
Dec 15, 1976
Bought by
Evans Ruth A
Create a Home Valuation Report for This Property
The Home Valuation Report is an in-depth analysis detailing your home's value as well as a comparison with similar homes in the area
Home Values in the Area
Average Home Value in this Area
Purchase History
| Date | Buyer | Sale Price | Title Company |
|---|---|---|---|
| Kirsner John M | $1,100,000 | Talon Group | |
| Capital Trading Co | -- | Attorney | |
| Evans Ruth A | -- | -- |
Source: Public Records
Mortgage History
| Date | Status | Borrower | Loan Amount |
|---|---|---|---|
| Open | Kirsner John M | $463,000 | |
| Closed | Kirsner John M | $417,000 |
Source: Public Records
Tax History
| Year | Tax Paid | Tax Assessment Tax Assessment Total Assessment is a certain percentage of the fair market value that is determined by local assessors to be the total taxable value of land and additions on the property. | Land | Improvement |
|---|---|---|---|---|
| 2025 | $34,157 | $590,000 | $164,640 | $425,360 |
| 2024 | $34,157 | $590,000 | $164,640 | $425,360 |
| 2023 | $33,733 | $589,995 | $164,640 | $425,355 |
| 2022 | $34,025 | $486,930 | $116,240 | $370,690 |
| 2021 | $30,120 | $486,930 | $116,240 | $370,690 |
| 2020 | $29,853 | $486,930 | $116,240 | $370,690 |
| 2019 | $28,651 | $413,180 | $116,240 | $296,940 |
| 2018 | $26,946 | $413,180 | $116,240 | $296,940 |
| 2017 | $26,929 | $413,180 | $116,240 | $296,940 |
| 2016 | $25,426 | $384,550 | $104,410 | $280,140 |
| 2015 | $25,404 | $384,550 | $104,410 | $280,140 |
| 2014 | $25,432 | $384,550 | $104,410 | $280,140 |
| 2013 | $12,144 | $349,580 | $94,920 | $254,660 |
Source: Public Records
Map
Nearby Homes
- 2593 Olde Hill Ct N Unit D2593
- 2827 Katmai Dr
- The Sierra Plan at Quarry Trails - Single Family Homes
- The Aspen Plan at Quarry Trails - Single Family Homes
- The Whitney Plan at Quarry Trails - Single Family Homes
- 2833 Katmai Dr
- 2808 Kobuk Dr
- 2835 Katmai Dr
- 2800 Kobuk Dr
- 2841 Katmai Dr
- 2845 Katmai Dr
- 2806 Kobuk Dr
- 2851 Katmai Dr
- 2837 Canterbury Ln
- 2812 Kobuk Dr
- 2828 Kobuk Dr
- 2853 Katmai Dr
- 2832 Kobuk Dr
- 2782 Chateau Cir S Unit 45
- 2502 Quarry Trails Dr
- 2589 Sherwin Rd
- 2613 Sherwin Rd
- 2580 Onandaga Dr
- 2575 Sherwin Rd
- 2570 Onandaga Dr
- 2610 Sherwin Rd
- 2590 Onandaga Dr
- 2628 Sherwin Rd
- 2558 Onandaga Dr
- 2580 Sherwin Rd
- 2561 Sherwin Rd
- 2639 Leeds Rd
- 2548 Onandaga Dr
- 2621 Leeds Rd
- 2700 Leeds Rd
- 2640 Crafton Park
- 2568 Sherwin Rd
- 2538 Onandaga Dr
- 2545 Sherwin Rd
- 2555 Onandaga Dr
Your Personal Tour Guide
Ask me questions while you tour the home.