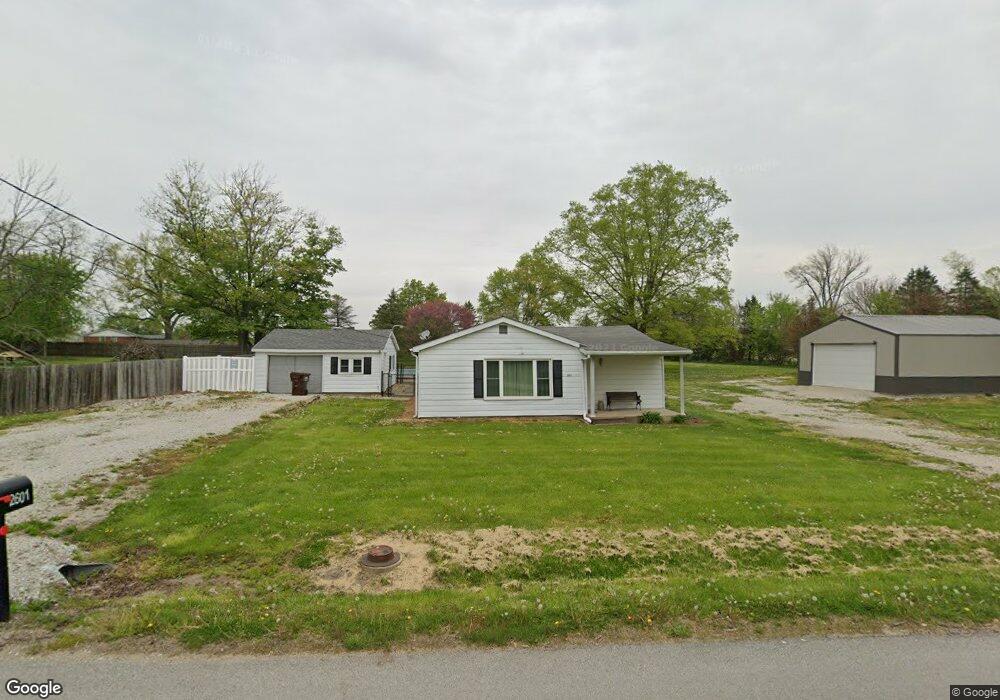
2601 W New Goshen Ave New Goshen, IN 47863
Estimated Value: $104,000 - $172,000
2
Beds
1
Bath
964
Sq Ft
$147/Sq Ft
Est. Value
About This Home
This home is located at 2601 W New Goshen Ave, New Goshen, IN 47863 and is currently estimated at $141,234, approximately $146 per square foot. 2601 W New Goshen Ave is a home located in Vigo County with nearby schools including Fayette Elementary School, West Vigo Middle School, and West Vigo High School.
Ownership History
Date
Name
Owned For
Owner Type
Purchase Details
Closed on
Aug 4, 2022
Sold by
Chitwood Jordan
Bought by
Riley Mary Ann
Current Estimated Value
Purchase Details
Closed on
Oct 23, 2018
Sold by
Caplinger Joshua W and Caplinger Jennifer A
Bought by
Chitwood Jordan
Home Financials for this Owner
Home Financials are based on the most recent Mortgage that was taken out on this home.
Original Mortgage
$76,095
Interest Rate
4.87%
Mortgage Type
FHA
Purchase Details
Closed on
Jan 31, 2017
Sold by
Endress Lawrence J and Endress Larry J
Bought by
Caplinger Joshua W and Caplinger Jennifer A
Home Financials for this Owner
Home Financials are based on the most recent Mortgage that was taken out on this home.
Original Mortgage
$66,565
Interest Rate
4.2%
Mortgage Type
New Conventional
Create a Home Valuation Report for This Property
The Home Valuation Report is an in-depth analysis detailing your home's value as well as a comparison with similar homes in the area
Home Values in the Area
Average Home Value in this Area
Purchase History
| Date | Buyer | Sale Price | Title Company |
|---|---|---|---|
| Riley Mary Ann | $150,000 | Aames Title & Closing Llc | |
| Chitwood Jordan | -- | None Available | |
| Caplinger Joshua W | -- | Integrity Title Services |
Source: Public Records
Mortgage History
| Date | Status | Borrower | Loan Amount |
|---|---|---|---|
| Previous Owner | Chitwood Jordan | $76,095 | |
| Previous Owner | Caplinger Joshua W | $66,565 |
Source: Public Records
Tax History Compared to Growth
Tax History
| Year | Tax Paid | Tax Assessment Tax Assessment Total Assessment is a certain percentage of the fair market value that is determined by local assessors to be the total taxable value of land and additions on the property. | Land | Improvement |
|---|---|---|---|---|
| 2024 | $365 | $100,600 | $12,900 | $87,700 |
| 2023 | $1,102 | $98,000 | $12,900 | $85,100 |
| 2022 | $1,069 | $93,300 | $12,900 | $80,400 |
| 2021 | $984 | $89,300 | $16,600 | $72,700 |
| 2020 | $946 | $90,800 | $16,600 | $74,200 |
| 2019 | $572 | $73,900 | $16,400 | $57,500 |
| 2018 | $450 | $57,800 | $7,900 | $49,900 |
| 2017 | $311 | $57,500 | $7,400 | $50,100 |
| 2016 | $1,044 | $55,600 | $7,200 | $48,400 |
| 2014 | $964 | $53,100 | $7,000 | $46,100 |
| 2013 | $964 | $53,100 | $7,000 | $46,100 |
Source: Public Records
Map
Nearby Homes
- 0 W Trinity Ave
- 8744 N Watson Place
- 8690 N Watson Place
- 825 W Krislynn Woods Ave
- 0 W Krislynn Woods Ave
- 581 W Krislynn Woods Ave
- 401 W Suncrest Wood Ave
- 213 W Sweet Briar Wood Ave
- 381 N Shew St
- 389 S Bunsen St
- 312 S Clinton St
- 235 Ridge St
- 11090 N Libertyville Place
- 1790 W Apple Ave
- 2975 Tanglewood Ln
- 3952 Keegan Rd
- Tract 1 74th Place
- Tract 4 74th Place
- 2840 E 1700 S
- 5304 N 15th St
- 9545 N Beech Place
- 2875 W Pear Ave
- 2840 Durkees Ferry Rd
- 9355 N Beech Place
- 2865 W Pear Ave
- 2868 Durkees Ferry Rd
- 2830 Durkees Ferry Rd
- 9500 N Range Line Place
- 2817 Durkees Ferry Rd
- 2860 W Pear Ave
- 2701 Durkees Ferry Rd
- 9563 N Range Line Place
- 9430 N Range Line Place
- 2969 W Cherry Ave
- 2936 W Cherry Ave
- 9591 N Range Line Place
- 9655 N Beech Place
- 2877 W Elm Ave
- 2775 Durkees Ferry Rd
- 9619 N Range Line Place