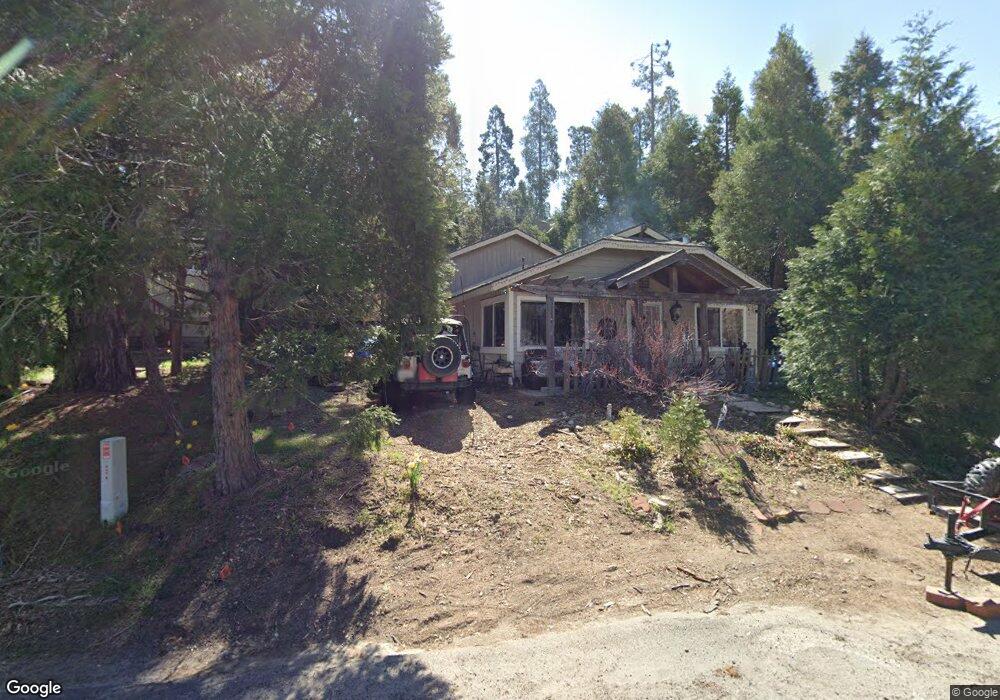
26013 State Highway 189 Twin Peaks, CA 92391
Estimated Value: $346,000 - $471,000
3
Beds
2
Baths
1,542
Sq Ft
$257/Sq Ft
Est. Value
About This Home
This home is located at 26013 State Highway 189, Twin Peaks, CA 92391 and is currently estimated at $396,555, approximately $257 per square foot. 26013 State Highway 189 is a home with nearby schools including Valley Of Enchantment Elementary School, Mary P. Henck Intermediate School, and Rim Of The World Senior High School.
Ownership History
Date
Name
Owned For
Owner Type
Purchase Details
Closed on
Feb 16, 2022
Sold by
Langston Robert L and Langston Josephine B
Bought by
Rush James F and Rush Alicia L
Current Estimated Value
Home Financials for this Owner
Home Financials are based on the most recent Mortgage that was taken out on this home.
Original Mortgage
$291,555
Interest Rate
3.69%
Purchase Details
Closed on
Apr 5, 2010
Sold by
Worthington Properties Llc
Bought by
Langston Robert L and Langston Josephine B
Purchase Details
Closed on
Feb 1, 2007
Sold by
Harb Carol J
Bought by
Worthington Properties Llc
Home Financials for this Owner
Home Financials are based on the most recent Mortgage that was taken out on this home.
Original Mortgage
$220,000
Interest Rate
6.23%
Mortgage Type
Purchase Money Mortgage
Create a Home Valuation Report for This Property
The Home Valuation Report is an in-depth analysis detailing your home's value as well as a comparison with similar homes in the area
Home Values in the Area
Average Home Value in this Area
Purchase History
| Date | Buyer | Sale Price | Title Company |
|---|---|---|---|
| Rush James F | $285,000 | Lawyers Title | |
| Langston Robert L | -- | None Available | |
| Worthington Properties Llc | $116,000 | First American Title Company |
Source: Public Records
Mortgage History
| Date | Status | Borrower | Loan Amount |
|---|---|---|---|
| Previous Owner | Rush James F | $291,555 | |
| Previous Owner | Worthington Properties Llc | $220,000 |
Source: Public Records
Tax History Compared to Growth
Tax History
| Year | Tax Paid | Tax Assessment Tax Assessment Total Assessment is a certain percentage of the fair market value that is determined by local assessors to be the total taxable value of land and additions on the property. | Land | Improvement |
|---|---|---|---|---|
| 2025 | $4,516 | $302,445 | $45,367 | $257,078 |
| 2024 | $4,516 | $296,514 | $44,477 | $252,037 |
| 2023 | $4,443 | $290,700 | $43,605 | $247,095 |
| 2022 | $4,502 | $291,931 | $36,492 | $255,439 |
| 2021 | $4,452 | $286,206 | $35,776 | $250,430 |
| 2020 | $4,458 | $283,271 | $35,409 | $247,862 |
| 2019 | $4,344 | $277,717 | $34,715 | $243,002 |
| 2018 | $3,771 | $253,700 | $38,100 | $215,600 |
| 2017 | $3,547 | $236,000 | $35,400 | $200,600 |
| 2016 | $3,311 | $222,600 | $33,400 | $189,200 |
| 2015 | $3,203 | $210,000 | $31,500 | $178,500 |
| 2014 | $3,077 | $200,000 | $30,000 | $170,000 |
Source: Public Records
Map
Nearby Homes
- 25286 25286 North
- 25907 Mile Pine Rd
- 26520 Walnut Hills Dr
- 260 S Fairway Dr
- 0 Lake Forest Boulder Unit IG25041937
- 0 Hwy 189 Unit IG24229527
- 28 Forest Ln
- 26166 Alpine Ln
- 25837 Sunset Loop
- 629 Lodge Ln
- 814 Glen View Ln
- 681 Clubhouse Dr
- 628 Rose Ln
- 619 Rose Ln
- 26251 Alpine Ln
- 841 Glen View Ln
- 26293 California 189
- 593 Clubhouse Dr
- 590 0 Rose Ln
- 1040 Mile High Rd
- 26019 State Highway 189
- 26009 State Highway 189
- 0 California 189
- 26023 State Highway 189
- 13 California 189
- 14 California 189
- 26003 State Highway 189
- 25560 Hi Ln
- 26031 California 189
- 26031 State Highway 189
- 26031 Highway 189
- 26068 Mile Pine Rd
- 26039 State Highway 189
- 26001 California 189
- 26001 State Highway 189
- 26001 Highway 189
- 26088 Mile Pine Rd
- 25999 State Highway 189
- 0 Mojave River Rd Unit SR17249092
- 0 Blue Jay Cut Off Unit EV12140938