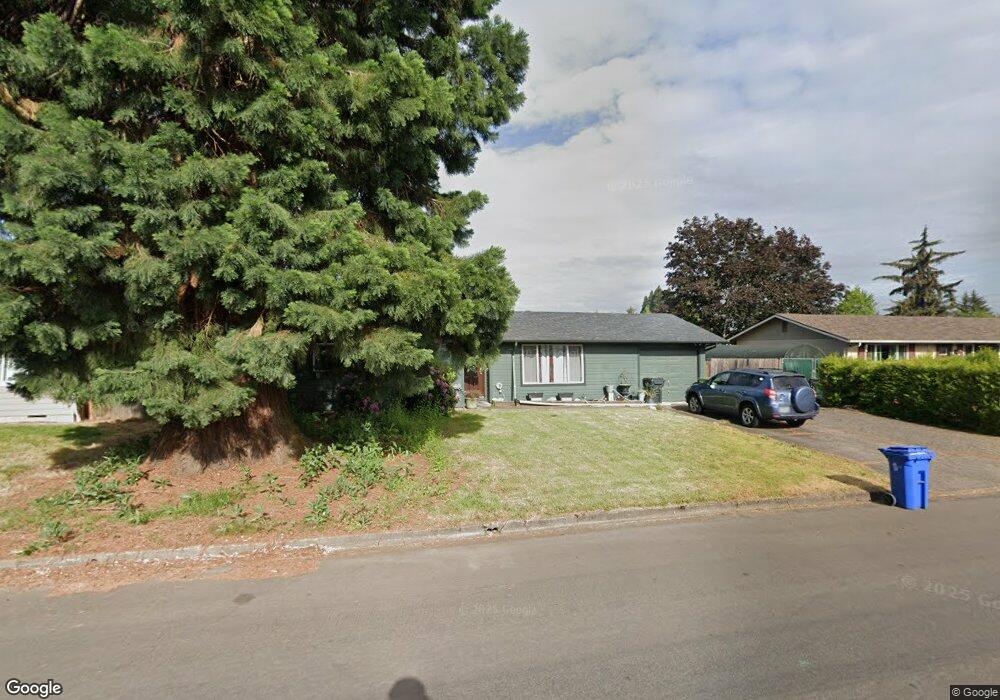
2602 Canterbury St Eugene, OR 97404
Santa Clara NeighborhoodEstimated Value: $351,095 - $369,000
3
Beds
2
Baths
952
Sq Ft
$374/Sq Ft
Est. Value
About This Home
This home is located at 2602 Canterbury St, Eugene, OR 97404 and is currently estimated at $356,274, approximately $374 per square foot. 2602 Canterbury St is a home located in Lane County with nearby schools including Spring Creek Elementary School, Madison Middle School, and North Eugene High School.
Ownership History
Date
Name
Owned For
Owner Type
Purchase Details
Closed on
Oct 22, 2014
Sold by
Parks Jason and Parks Elizabeth
Bought by
Wormsbecker Cindy M
Current Estimated Value
Home Financials for this Owner
Home Financials are based on the most recent Mortgage that was taken out on this home.
Original Mortgage
$136,000
Outstanding Balance
$104,347
Interest Rate
4.2%
Mortgage Type
New Conventional
Estimated Equity
$251,927
Purchase Details
Closed on
Aug 28, 2002
Sold by
Frey Kevin L and Frey Chris
Bought by
Parks Jason and Parks Elizabeth
Home Financials for this Owner
Home Financials are based on the most recent Mortgage that was taken out on this home.
Original Mortgage
$109,710
Interest Rate
8.25%
Purchase Details
Closed on
Mar 24, 1998
Sold by
Manzanita Estates Inc
Bought by
Frey Kevin L and Rowe Christine L
Home Financials for this Owner
Home Financials are based on the most recent Mortgage that was taken out on this home.
Original Mortgage
$101,432
Interest Rate
7.02%
Mortgage Type
FHA
Create a Home Valuation Report for This Property
The Home Valuation Report is an in-depth analysis detailing your home's value as well as a comparison with similar homes in the area
Home Values in the Area
Average Home Value in this Area
Purchase History
| Date | Buyer | Sale Price | Title Company |
|---|---|---|---|
| Wormsbecker Cindy M | $170,000 | First American Title | |
| Parks Jason | $121,900 | Fidelity National Title Co | |
| Frey Kevin L | $102,000 | Fidelity National Title Co |
Source: Public Records
Mortgage History
| Date | Status | Borrower | Loan Amount |
|---|---|---|---|
| Open | Wormsbecker Cindy M | $136,000 | |
| Previous Owner | Parks Jason | $109,710 | |
| Previous Owner | Frey Kevin L | $101,432 |
Source: Public Records
Tax History
| Year | Tax Paid | Tax Assessment Tax Assessment Total Assessment is a certain percentage of the fair market value that is determined by local assessors to be the total taxable value of land and additions on the property. | Land | Improvement |
|---|---|---|---|---|
| 2025 | $2,135 | $166,786 | -- | -- |
| 2024 | $2,124 | $161,929 | -- | -- |
| 2023 | $2,124 | $157,213 | $0 | $0 |
| 2022 | $1,996 | $152,634 | $0 | $0 |
| 2021 | $1,831 | $148,189 | $0 | $0 |
| 2020 | $1,866 | $143,873 | $0 | $0 |
| 2019 | $1,796 | $139,683 | $0 | $0 |
| 2018 | $1,654 | $131,665 | $0 | $0 |
| 2017 | $1,578 | $131,665 | $0 | $0 |
| 2016 | $1,471 | $127,830 | $0 | $0 |
| 2015 | $1,411 | $124,107 | $0 | $0 |
| 2014 | $1,292 | $120,492 | $0 | $0 |
Source: Public Records
Map
Nearby Homes
- 805 Impala Ave
- 2563 York St
- 2721 La Darrah St
- 2488 Northampton
- 2418 Kalmia St
- 541 Durham Ave
- 2987 Dry Creek Rd
- 2965 Teal Place
- 2610 Crowther Dr
- 2580 Crowther Dr
- 2931 Shelby Way
- 349 Irving Rd
- 303 Lenore Loop
- 1256 Frogs Leap Ln
- 1265 Napa Creek Dr
- 200 Irving Rd
- 1307 Bramblewood Ln
- 3256 Marvin Dr
- 215 Jonquil Ave
- 2439 Quince St
- 2634 Canterbury St
- 777 Impala Ave
- 795 Impala Ave
- 2576 Canterbury St
- 2658 Canterbury St
- 2601 Canterbury St
- 753 Impala Ave
- 2635 Canterbury St
- 2597 Canterbury St
- 827 Impala Ave
- 2659 Canterbury St
- 2573 Canterbury St
- 2666 Canterbury St
- 2558 Canterbury St
- 739 Impala Ave
- 824 Corvette Ln
- 2604 Carbona St
- 2636 Carbona St
- 2588 Carbona St
Your Personal Tour Guide
Ask me questions while you tour the home.