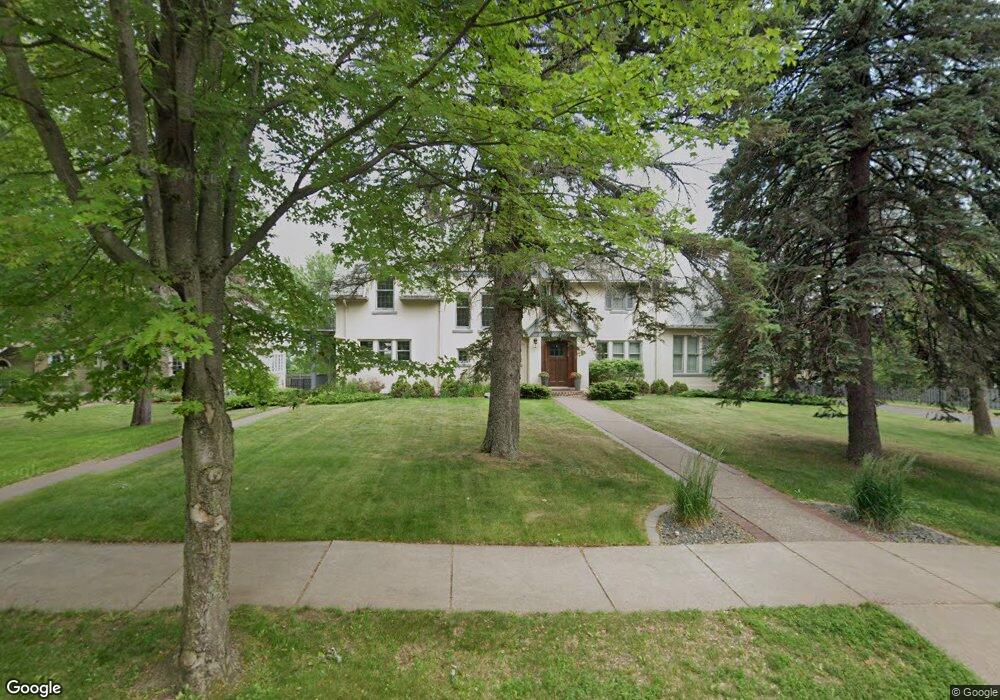
2602 E 3rd St Duluth, MN 55812
Congdon Park NeighborhoodEstimated Value: $876,000 - $940,000
6
Beds
5
Baths
5,382
Sq Ft
$169/Sq Ft
Est. Value
About This Home
This home is located at 2602 E 3rd St, Duluth, MN 55812 and is currently estimated at $909,664, approximately $169 per square foot. 2602 E 3rd St is a home located in St. Louis County with nearby schools including Congdon Elementary School, Ordean East Middle School, and East High School.
Ownership History
Date
Name
Owned For
Owner Type
Purchase Details
Closed on
Sep 15, 2004
Sold by
Smith Natalie Sue
Bought by
Holliday George Francis and Holliday Colleen C
Current Estimated Value
Home Financials for this Owner
Home Financials are based on the most recent Mortgage that was taken out on this home.
Original Mortgage
$333,700
Interest Rate
5.8%
Mortgage Type
Unknown
Create a Home Valuation Report for This Property
The Home Valuation Report is an in-depth analysis detailing your home's value as well as a comparison with similar homes in the area
Home Values in the Area
Average Home Value in this Area
Purchase History
| Date | Buyer | Sale Price | Title Company |
|---|---|---|---|
| Holliday George Francis | $536,000 | Pioneer Abstract & Title Of |
Source: Public Records
Mortgage History
| Date | Status | Borrower | Loan Amount |
|---|---|---|---|
| Previous Owner | Holliday George Francis | $333,700 |
Source: Public Records
Tax History
| Year | Tax Paid | Tax Assessment Tax Assessment Total Assessment is a certain percentage of the fair market value that is determined by local assessors to be the total taxable value of land and additions on the property. | Land | Improvement |
|---|---|---|---|---|
| 2024 | $12,710 | $850,700 | $79,400 | $771,300 |
| 2023 | $12,710 | $821,800 | $78,300 | $743,500 |
| 2022 | $12,612 | $724,000 | $69,600 | $654,400 |
| 2021 | $10,090 | $598,800 | $56,800 | $542,000 |
| 2020 | $10,188 | $603,300 | $56,800 | $546,500 |
| 2019 | $9,902 | $593,600 | $51,400 | $542,200 |
| 2018 | $9,270 | $583,200 | $51,400 | $531,800 |
| 2017 | $8,388 | $583,300 | $51,500 | $531,800 |
| 2016 | $8,178 | $0 | $0 | $0 |
| 2015 | $8,151 | $525,700 | $82,900 | $442,800 |
| 2014 | $8,151 | $525,700 | $82,900 | $442,800 |
Source: Public Records
Map
Nearby Homes
- 2415 E 2nd St
- 2815 E 2nd St
- 2328 E 3rd St
- 2514 E Superior St
- 2510 E Superior St
- 16 S 25th Ave E
- 2501 Branch St
- 2610 E 8th St
- xxx E 2nd St
- 2123 E 4th St
- 2101 E 1st St
- 625 Woodland Ave
- 619 Woodland Ave
- 124 N Hawthorne Rd
- 627 N 20th Ave E
- 1914 E 1st St
- 721 N 20th Ave E
- 1905 E Superior St
- 1901 E Superior St
- 629 N 19th Ave E
Your Personal Tour Guide
Ask me questions while you tour the home.