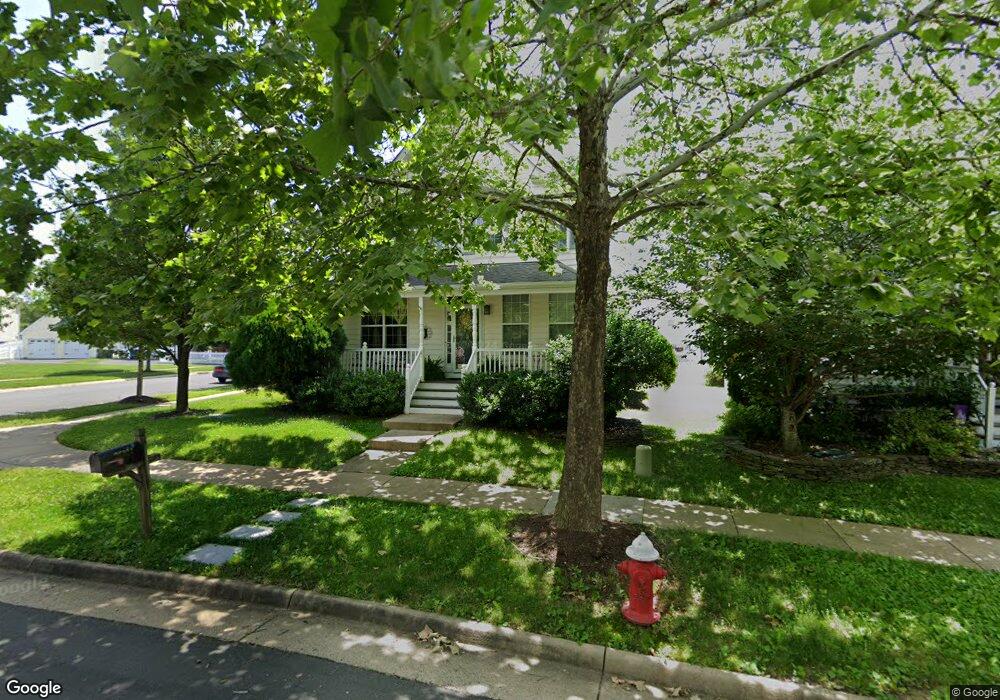
26024 Pembrooke Cir Chantilly, VA 20152
Estimated Value: $829,000 - $964,000
4
Beds
4
Baths
2,096
Sq Ft
$416/Sq Ft
Est. Value
About This Home
This home is located at 26024 Pembrooke Cir, Chantilly, VA 20152 and is currently estimated at $871,791, approximately $415 per square foot. 26024 Pembrooke Cir is a home located in Loudoun County with nearby schools including Little River Elementary School, J. Michael Lunsford Middle School, and Freedom High School.
Ownership History
Date
Name
Owned For
Owner Type
Purchase Details
Closed on
Mar 15, 2024
Sold by
Jenkins Kellee Loy and Jenkins David Michael
Bought by
Jenkins Revocable Living Trust and Jenkins
Current Estimated Value
Purchase Details
Closed on
Jun 30, 2005
Sold by
Raba Matthew J
Bought by
Jenkins David L
Home Financials for this Owner
Home Financials are based on the most recent Mortgage that was taken out on this home.
Original Mortgage
$423,000
Interest Rate
5.73%
Mortgage Type
New Conventional
Purchase Details
Closed on
Dec 27, 2000
Sold by
South Riding L P
Bought by
Raba Matthew J
Home Financials for this Owner
Home Financials are based on the most recent Mortgage that was taken out on this home.
Original Mortgage
$205,250
Interest Rate
7.69%
Create a Home Valuation Report for This Property
The Home Valuation Report is an in-depth analysis detailing your home's value as well as a comparison with similar homes in the area
Home Values in the Area
Average Home Value in this Area
Purchase History
| Date | Buyer | Sale Price | Title Company |
|---|---|---|---|
| Jenkins Revocable Living Trust | -- | None Listed On Document | |
| Jenkins David L | $600,000 | -- | |
| Raba Matthew J | $256,611 | -- |
Source: Public Records
Mortgage History
| Date | Status | Borrower | Loan Amount |
|---|---|---|---|
| Previous Owner | Jenkins David L | $423,000 | |
| Previous Owner | Raba Matthew J | $205,250 |
Source: Public Records
Tax History Compared to Growth
Tax History
| Year | Tax Paid | Tax Assessment Tax Assessment Total Assessment is a certain percentage of the fair market value that is determined by local assessors to be the total taxable value of land and additions on the property. | Land | Improvement |
|---|---|---|---|---|
| 2025 | $6,236 | $774,700 | $273,800 | $500,900 |
| 2024 | $6,349 | $733,940 | $273,800 | $460,140 |
| 2023 | $5,950 | $679,970 | $273,800 | $406,170 |
| 2022 | $5,848 | $657,120 | $243,800 | $413,320 |
| 2021 | $5,673 | $578,830 | $213,800 | $365,030 |
| 2020 | $5,461 | $527,610 | $198,800 | $328,810 |
| 2019 | $5,416 | $518,280 | $198,800 | $319,480 |
| 2018 | $5,283 | $486,920 | $178,800 | $308,120 |
| 2017 | $5,239 | $465,730 | $178,800 | $286,930 |
| 2016 | $5,275 | $460,740 | $0 | $0 |
| 2015 | $5,185 | $278,000 | $0 | $278,000 |
| 2014 | $5,156 | $267,630 | $0 | $267,630 |
Source: Public Records
Map
Nearby Homes
- 26005 Hartwood Dr
- 25897 Flintonbridge Dr
- 43636 Obrien Square
- 26134 Lands End Dr
- 4628 Fairfax Manor Ct
- 4621 Fairfax Manor Ct
- 25817 Spring Farm Cir
- 43438 Mink Meadows St
- 25843 Priesters Pond Dr
- 4610 Fairfax Manor Ct
- 0 Fairfax Manor Ct Unit VAFX2160912
- 4620 Pleasant Valley Rd
- 4615 Fairfax Manor Ct
- 4616 Fairfax Manor Ct
- 4622 Fairfax Manor Ct
- 0 Pleasant Valley Rd Unit VAFX2264084
- 0 Pleasant Valley Rd Unit VAFX2264140
- 43441 Bettys Farm Dr
- 4480 Pleasant Valley Rd
- 43356 Hillpark St
- 26028 Pembrooke Cir
- 26032 Pembrooke Cir
- 26016 Pembrooke Cir
- 25993 Hartwood Dr
- 25997 Hartwood Dr
- 26001 Hartwood Dr
- 26036 Pembrooke Cir
- 26012 Pembrooke Cir
- 25985 Hartwood Dr
- 26009 Hartwood Dr
- 26013 Hartwood Dr
- 26040 Pembrooke Cir
- 25981 Hartwood Dr
- 26008 Pembrooke Cir
- 26017 Hartwood Dr
- 25977 Hartwood Dr
- 26021 Hartwood Dr
- 26044 Pembrooke Cir
- 26004 Pembrooke Cir
- 43673 Primanti St