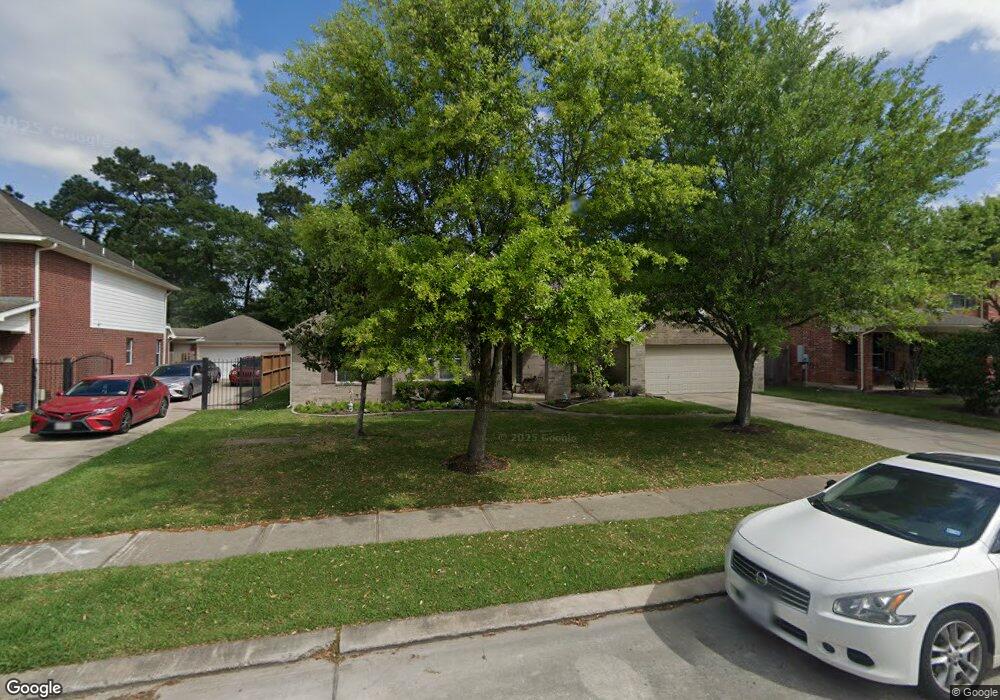
2603 Bridgestone Park Ln Spring, TX 77386
Imperial Oaks NeighborhoodEstimated Value: $405,712 - $501,000
3
Beds
3
Baths
2,803
Sq Ft
$157/Sq Ft
Est. Value
About This Home
This home is located at 2603 Bridgestone Park Ln, Spring, TX 77386 and is currently estimated at $439,928, approximately $156 per square foot. 2603 Bridgestone Park Ln is a home located in Montgomery County with nearby schools including Kaufman Elementary School, Vogel Intermediate School, and Irons J High School.
Ownership History
Date
Name
Owned For
Owner Type
Purchase Details
Closed on
Aug 26, 2011
Sold by
Francis Timothy and Leung Anita
Bought by
Mccurdy Ernest B and Mccurdy Susan C
Current Estimated Value
Home Financials for this Owner
Home Financials are based on the most recent Mortgage that was taken out on this home.
Original Mortgage
$145,000
Outstanding Balance
$13,024
Interest Rate
4.54%
Mortgage Type
New Conventional
Estimated Equity
$426,904
Purchase Details
Closed on
Apr 15, 2005
Sold by
Weekley Homes Lp
Bought by
Mccurdy Ernest B and Mccurdy Susan C
Home Financials for this Owner
Home Financials are based on the most recent Mortgage that was taken out on this home.
Original Mortgage
$118,381
Interest Rate
5.89%
Mortgage Type
Fannie Mae Freddie Mac
Purchase Details
Closed on
Dec 16, 2004
Sold by
Imperial Oaks #3 Ltd
Bought by
Weekley Homes Lp
Create a Home Valuation Report for This Property
The Home Valuation Report is an in-depth analysis detailing your home's value as well as a comparison with similar homes in the area
Home Values in the Area
Average Home Value in this Area
Purchase History
| Date | Buyer | Sale Price | Title Company |
|---|---|---|---|
| Mccurdy Ernest B | -- | First American Title | |
| Mccurdy Ernest B | -- | -- | |
| Francis Timothy | -- | Priority Title Co | |
| Weekley Homes Lp | -- | Priority Title Co |
Source: Public Records
Mortgage History
| Date | Status | Borrower | Loan Amount |
|---|---|---|---|
| Open | Mccurdy Ernest B | $145,000 | |
| Previous Owner | Francis Timothy | $118,381 |
Source: Public Records
Tax History Compared to Growth
Tax History
| Year | Tax Paid | Tax Assessment Tax Assessment Total Assessment is a certain percentage of the fair market value that is determined by local assessors to be the total taxable value of land and additions on the property. | Land | Improvement |
|---|---|---|---|---|
| 2025 | $4,453 | $377,157 | -- | -- |
| 2024 | $4,295 | $342,870 | -- | -- |
| 2023 | $4,295 | $311,700 | $80,000 | $299,930 |
| 2022 | $7,240 | $283,360 | $26,500 | $308,040 |
| 2021 | $7,117 | $257,600 | $26,500 | $231,100 |
| 2020 | $7,073 | $245,220 | $26,500 | $218,720 |
| 2019 | $7,437 | $250,860 | $26,500 | $224,360 |
| 2018 | $5,970 | $250,860 | $26,500 | $224,360 |
| 2017 | $7,622 | $255,640 | $26,500 | $229,140 |
| 2016 | $7,622 | $255,640 | $26,500 | $229,140 |
| 2015 | $6,266 | $237,930 | $26,500 | $214,720 |
| 2014 | $6,266 | $216,300 | $26,500 | $189,800 |
Source: Public Records
Map
Nearby Homes
- 2618 Bridgestone Park Ln
- 31214 Windcrest Park Ln
- 31235 Windcrest Park Ln
- 31419 Fountainbrook Park Ln
- 32364 Mossy Pine Way
- 31030 S Imperial Path Ln
- 2526 Hidden Park Ln
- 31602 Forest Oak Park Ct
- 2954 Smokey Forest Ln
- 3002 Rusty Bridge Ct
- 30915 Still Oaks Ln
- 32331 Summer Park Ln
- 31011 Imperial Walk Ln
- 32315 Golden Oak Park Ln
- 2047 Copperwood Park Ln
- 30707 Dodson Trace Dr
- 2143 Westover Park Cir
- 32319 Archer Park
- 31563 Ember Trail Ln
- 31815 Forest Oak Ln
- 2607 Bridgestone Park Ln
- 2523 Bridgestone Park Ln
- 2519 Bridgestone Park Ln
- 2611 Bridgestone Park Ln
- 2602 Bridgestone Park Ln
- 2606 Bridgestone Park Ln
- 2518 Bridgestone Park Ln
- 2615 Bridgestone Park Ln
- 2515 Bridgestone Park Ln
- 2602 Kenwood Park Ln
- 2610 Bridgestone Park Ln
- 2606 Kenwood Park Ln
- 2610 Kenwood Park Ln
- 2614 Kenwood Park Ln
- 2510 Kenwood Park Ln
- 2511 Bridgestone Park Ln
- 2619 Bridgestone Park Ln
- 2618 Kenwood Park Ln
- 2611 Avalon Forest Ct
- 2506 Kenwood Park Ln